Last Week
Weekly Outlook – SP&P 500 Cash Index (SPX)
The S&P 500 cash index ($SPX) closed at 2081.18 last Friday, down 20.88 points for net weekly loss of 1%.
It was a strange week: a sell-off on Monday and Tuesday, a strong overnight rally going into Wednesday, and a 40-point dump on Friday (Apr. 17). “Unsettled” doesn’t do it justice.
The sell-off might be seen as the result of depressing debt news from Greece and changes in market shorting rules from China. But in our view, it was an option game, with the price action tied to the April option expiration on Friday.
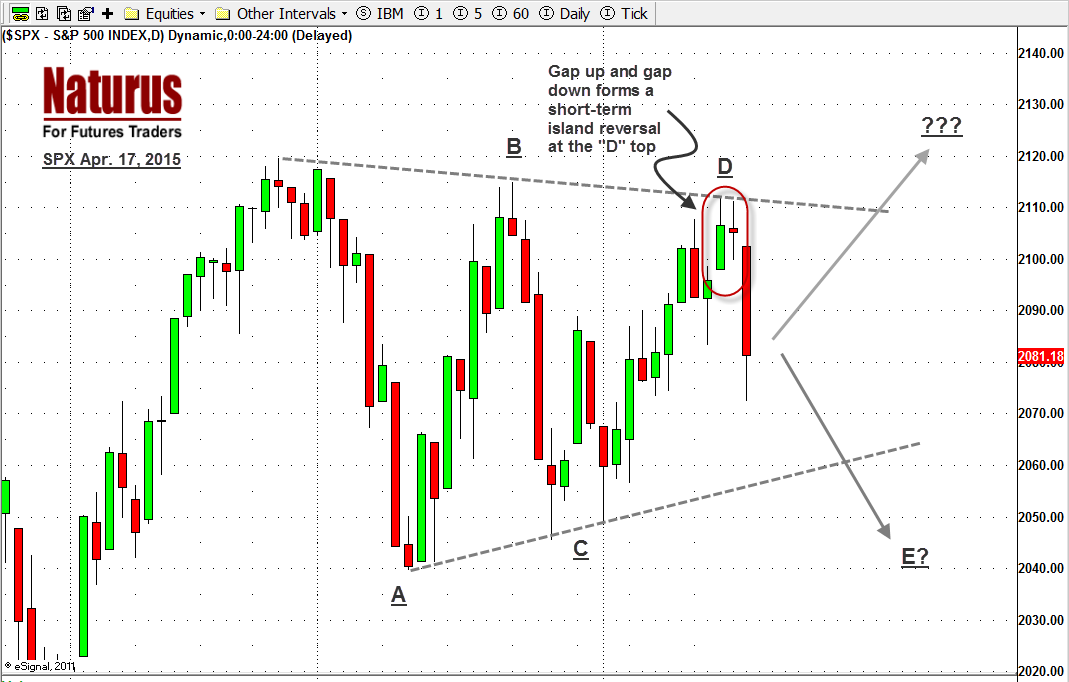
The index has been forming a number of interesting chart patterns, all of them subject to different interpretations. This past week the market gapped up and two days later gapped down, forming an island reversal (see chart) that is typically a short-term bearish pattern. But it is not likely to affect the long-term uptrend, which is still intact.
We are also still traveling within the “wedge” pattern that has been developing for a couple of months. Clearly at some point we will break out; but the direction is not clear. It is possible the SPX may continue like this, waiting listlessly for something to happen, while it builds a broad consolidation range that lasts for much of the year.
This Week
Right now the SPX is in the middle of the range between the top at 2110-15 – the current resistance zone – and the bottom at 2050-55, the current support zone. A dip into 2045-50 could form a triple bottom and top pattern. A break below 2035 will be bearish, and a further decline toward 1985-2000 should then be expected to follow.
In the absence of bad news from Europe there isn’t a lot that will obviously roil the markets this week. The continuing movement of NATO forces into aggressive postures near the Russian border – 300 U.S. paratroopers were sent to the Ukraine last week – is worrisome, but there is a sense that the market just doesn’t care anymore. That caravan has moved on. There will be something to get traders excited this week. We just don’t know what it is yet.
ESM5
Last week the ESM5, the current contract for the S&P 500 mini-futures, made a sort of head-fake move mid-week, threatening to break out to new highs, then failing to follow through and ending the week with a 40-point dump. Volume was thin on the upside move.
Today we may see the ES stay inside Friday’s range for consolidation in the early session, perhaps followed later by a breakout move. Friday’s range was quite wide, and we could easily make an inside day today.
A break above 2089 could lead the futures up to fill Friday’s unfilled gap at 2099.75. On the downside, a move below 2062.50 could push ES down to test the yearly pivot level at 2055. The short-term indicators have selling signals. Any bounce could give our ultra-short-term traders a chance to re-short again.
Major support levels: 2058-55, 2044-43, 2036.25-35.50
Major resistance levels: 2093.75-96.50, 2105-08, 2115.50-18.50
SPX Daily Chart Apr. – 17 2015

#####
Naturus.com publishes a free weekly analysis of US equity indices. You can get on the mailing list at this link.


