

Yesterday
The S&P 500 mini-futures, the ESM5, closed the day yesterday (Tuesday) exactly where it closed the day Monday, at 2091.00.
The minis ran up in overnight trading, when the volume is negligible, and managed a high at 2103.50, just below the recent resistance level.
But once the market opened and the traders saw the opportunity to short, it traded all the way back down to 2087.50, a decline of about 15 points on the day. Only a dead-cat bounce in the last hour prevented it from closing at the low.
We could have passed on the market yesterday, and spent the time sitting in bed reading. This market is just killing time, waiting for time to kill it.
Today
As we said in yesterday’s commentary, the traders saw every bounce as a short entry. We expect more of the same today.
Today 2087 remains the key line to watch. Holding above it will encourage some buyers. But a move below it could lead the price to drop back down to the 2078.50-74.50 zone or lower.
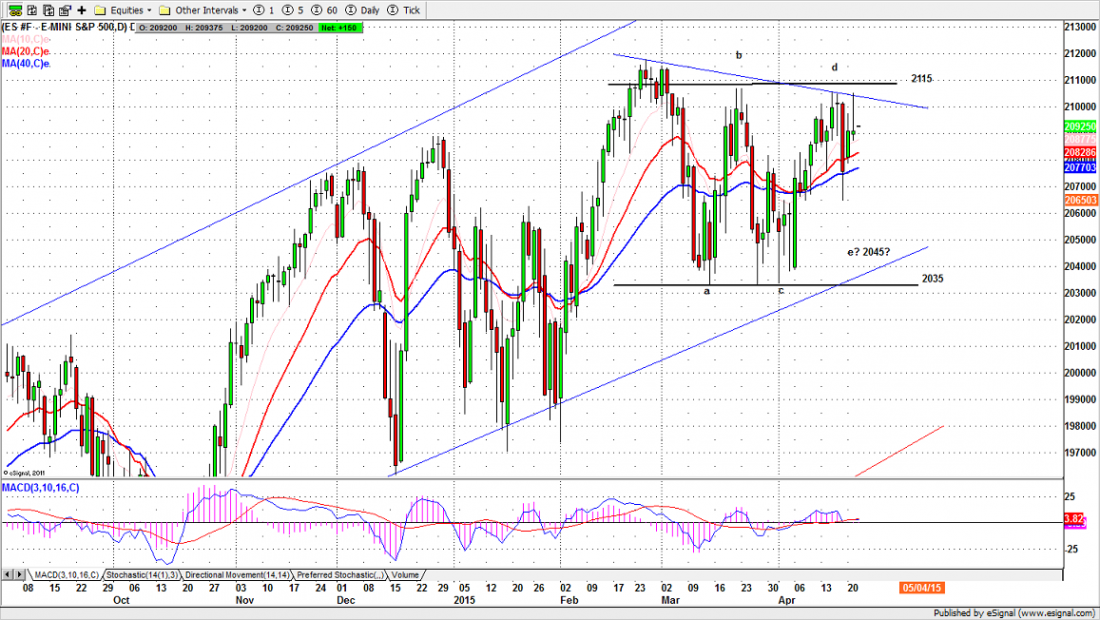
So far the ES remains within its broad range from 2115.50 to 2035. 20, with the 40-day EMA line acting like a magnet to pull the price back every time it moves too far away. This is typical behavior for a rectangle-pattern move.
The favorable seasonality for stocks will be ending in May. The market may use this recent rip and dip series of moves to kill time until we get there.
But as long as ES remains inside this broad range, our traders will look for opportunities to short on the strength and buy on the weakness.
- Major support levels for Wednesday: 2071-73, 2062.50-64.50, 2055-56.50
- Major resistance levels: 2107.50-08.50, 2117.25-21.50
ESM5 Daily Chart – Apr. 21, 2015
#####
Naturus.com publishes a free weekly analysis of US equity indices. To get on the mailing list,please click here.

