

Volume Profile gives us information on key levels of support and resistance (S/R). Although the High Volume Nodes and Low Volume Nodes often produce very precise reversals, S/R is best conceptualized as a zone.
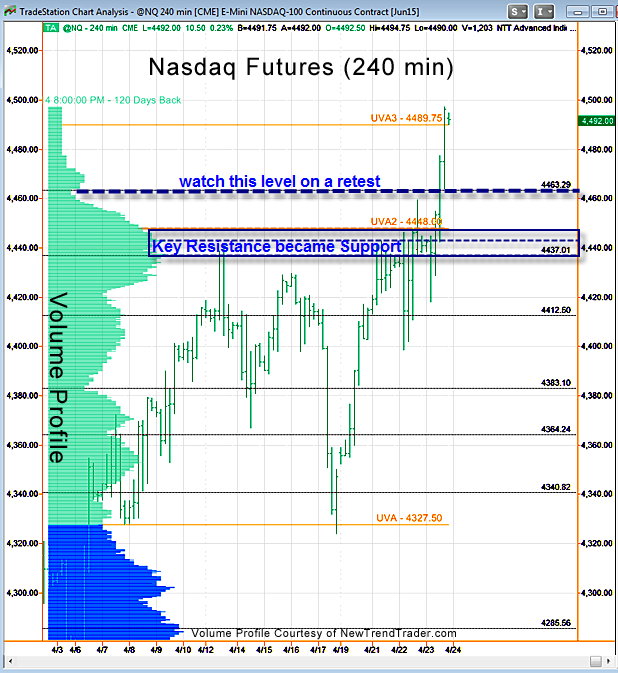
For the last few days, the key zone in the NQ has been centered around 4442. On Wednesday, a “scouting party” briefly probed above it, but a 40-point rejection reaction ensued.
This apparent failure can get traders bearish, but as noted yesterday, the “failure” can set up a better breakout later on. Shortly after the open on Thursday, the NQ quickly surmounted 4442, retested it precisely 90-minutes later and then staged the Big Breakout move 45-minutes later.
Volume Profile is most useful during pullbacks, not when markets are making forays into uncharted territory. Use other tools to project targets and keep an eye on 4463 if we get an immediate pullback.
A Note on Volume Profile
The histogram on the left side of the chart shows the volume distribution in the Nasdaq futures for different periods of time. Key support and resistance levels are indicated by the peaks and troughs.
#####
If you would like to receive a primer on using Volume Profile, please click here.

