Yesterday
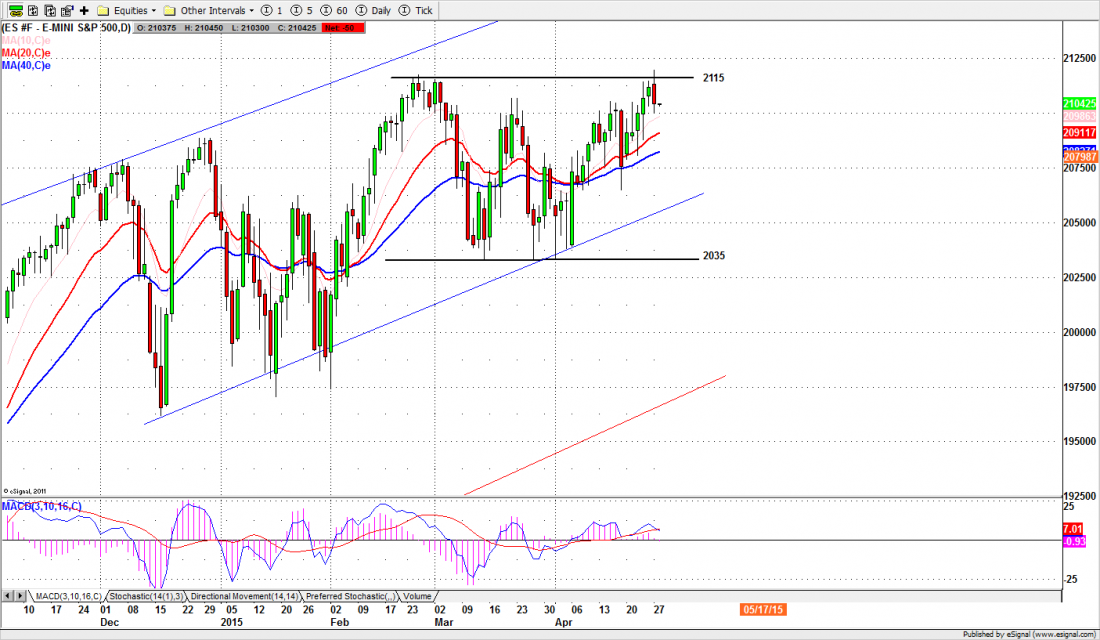
The S&P500 mini futures (ESM5) gapped up overnight Monday and rallied to a new high 2119.75 in the first hour of trading. Then they sickened and died for the rest of the day. The ES closed at 2104.75 – seven points below the previous close – and barely managed to bounce off the 2100 support, thanks to a little end-of-day profit taking from the shorts, who were singing and dancing all day long.
This is pretty much what we said would happen in yesterday’s post: an early rally, followed by a retracement to the psychological support at 2100. The market made a clear breakout of the resistance and a new all-time intraday high. It just didn’t feel very convincing.
The charts are bullish in all time frames. But the market has to climb a wall of worry to make new highs, and we’re still worried.
We’re more confident about the longer-term outlook, so long as US companies continue massive buy-backs of their own shares.
APPL, which beat earnings estimates as expected, has announced it will spend $140 billion to buy its own shares, and Goldman Sachs estimates that share buy-backs for the S&P500 as a whole will reach $900 billion this year.
Between the Fed and the corporations, we wonder who else is left to buy this stuff.
Today
The two-day FOMC meeting will begin today. In the early morning we may see the ES continue to trade at yesterday’s low area or slightly lower, near 2095-90; it will shake out the weak buyers if the selling persists through the day sessions.
If the selling persists we expect ES is going to make a low first for Wednesday’s FOMC announcement and bounce later in the week.
The 2100 psychological support is a key line for today. Holding above it would allow the ES to stay inside yesterday’s range and chop along to kill some time.
Despite the half-hearted breakout yesterday, 2115.50-17.50 still remains as a resistance zone. ES may rally to challenge it again, but if the resistance is broken we don’t expect the ES can go higher than 2125-23.50 today.
Major support levels for Tuesday: 2088.75-85, 2075-71, 2062.50-64.50, 2055-56.50;
the major resistance levels: 2117.25-21.50, 2129.50-32.50 2138.50-39.50

###
Naturus.com publishes a free weekly analysis of US equity indices. You can get on the mailing list at this link.
Related Story:


