

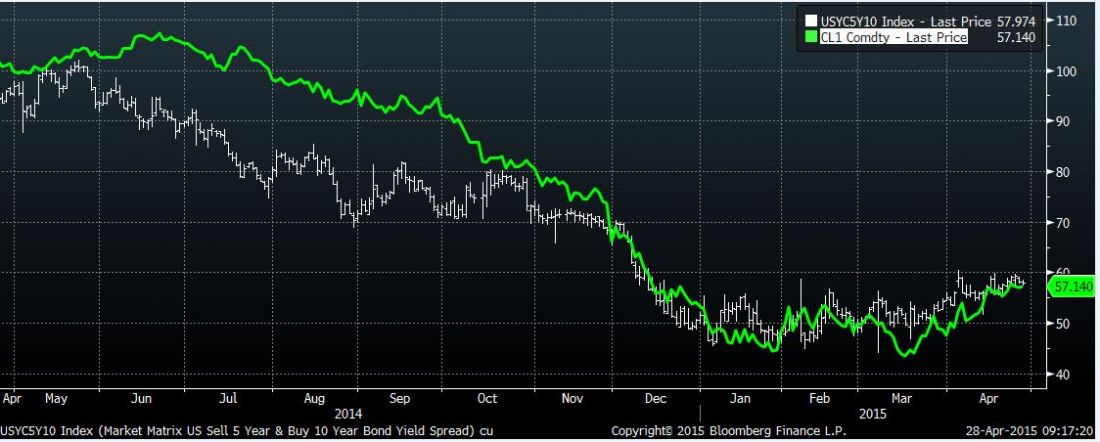
Below is a chart of front month Crude Oil, (green line) versus 5/10 treasury spread, (white bar chart). As crude oil declined through the end of 2014, the 5/10 treasury curve flattened, which makes sense, as inflation expectations were squeezed out of the market. However, since March, oil appears to have bottomed, the curve has become less contango, and several measures of inflation expectations have firmed up, including the spread between the ten year treasury yield and the inflation indexed note (TIP) yield.
With regard to the forward curve in crude, in late January the spread between June’15 Crude and June’16 (CLM’15/CLM’16) was almost $9.50, with the nearer contract at a discount. Now that spread is only $6.00. Over time, inventories are worked off and the market becomes somewhat more balanced. Apart from oil, a variety of other commodities have also been crushed, including Iron Ore (over 500 in January to 375 in early April), Lumber (340 to 240 in four months), and Copper (3.50 at the beginning of 2014 to below 2.50 in January of this year). However, some of these commodities seem to be putting in a bottom, related in some measure to dollar strength having abated.
Rate Hike Outlook
With regard to the ten year treasury vs tip yield spread, it supposedly indicates a long term inflation estimate. The TIP pays a coupon plus the CPI, the treasury note simply pays the coupon. I have watched this spread for a long time, and I honestly don’t think it accurately forecasts forward inflation, however, the direction of the spread is useful, and there is no question that it has bounced since the beginning of the year…in January the spread averaged around 160 bps and is now around 190 bps.
How does this relate to the US bond market in general?
There has been a strong underlying bid for US bonds, as the yields in many countries are much lower, with many short term sovereign notes trading at negative yields. The thought is that there is a hard cap on how much US yields can rise due to the global situation. On the other hand, there has been a chorus of market observers who believe the US is in a bond “bubble” and that rates could soar when the Fed begins to tighten. In general I have been more aligned with the former camp. However, I am turning more neutral to bearish on the longer end of the US curve, and it’s NOT because I think the Fed is going to aggressively hike rates. Quite the opposite. It’s because the Fed is likely to be very gradual if not glacial in terms of raising rates, which diminishes the bid for the US dollar. This in turn should support commodities, which have already started to turn. When a commodity falls from 50 to 25 and then in a year is at 30, the comparison for inflation purposes is the move from 25 to 30, a 20% increase…even though it’s nowhere near the original peak. YoY comps are going to start to look a bit more inflationary across many commodities.
This brings us back to the chart. The ten year yield is firming relative to the five year yield as oil moves up. The curve has a steepening bias and it appears to be due to incipient inflation of THINGS, not necessarily of wages, and it’s not necessarily due to economic strength which has been sorely lacking in Q1. Don’t be slavishly bullish on the long end due to global economic malaise. We could get a strong backup in long bond yields simply due to inflationary impulses, even if they’re not sustained over the long haul.
+++
For More from Alex Manzara, check out his Daily Blog

