

The target for Tuesday was the unfilled gap and the lower boundary of the Upper Value Area, then at 4482. (The Upper Value Area is colored light green on the chart.)
While this was an obvious target, the market nevertheless obliged with a vengeance, testing the Weekly Pivot at 4472.
The key resistance level now is the High Volume Node at 4522. Notably, the NQ was not able to close above it on the afternoon rebound. This establishes a ‘ceiling’ at 4522 and a ‘floor’ at the Weekly Pivot.
While Monday’s belong to the bears, Wednesday’s often inspire the bulls. Even so, I wouldn’t assume that the correction is over until we get an hourly close above 4522.
A Note on Volume Profile
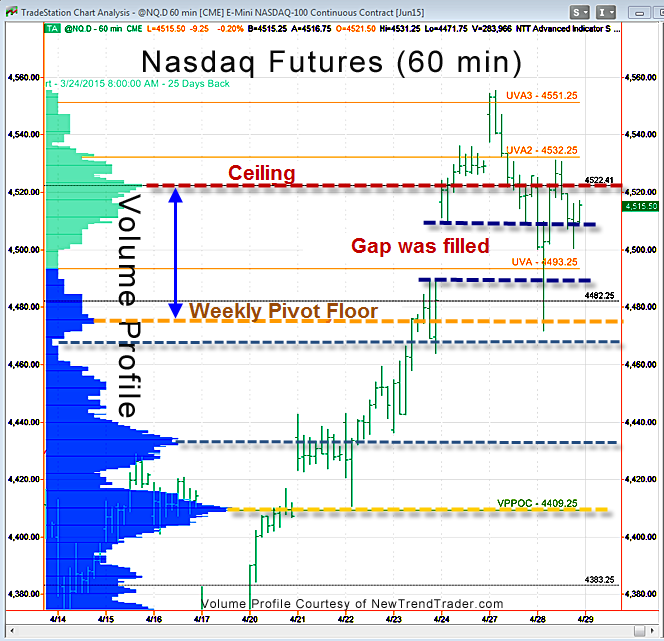
The histogram on the left side of the chart shows the volume distribution in the Nasdaq futures for different periods of time. Key support and resistance levels are indicated by the peaks and troughs. If you would like to receive a primer on using Volume Profile, please click here: www.daytradingpsychology.com/contact

