

Last week
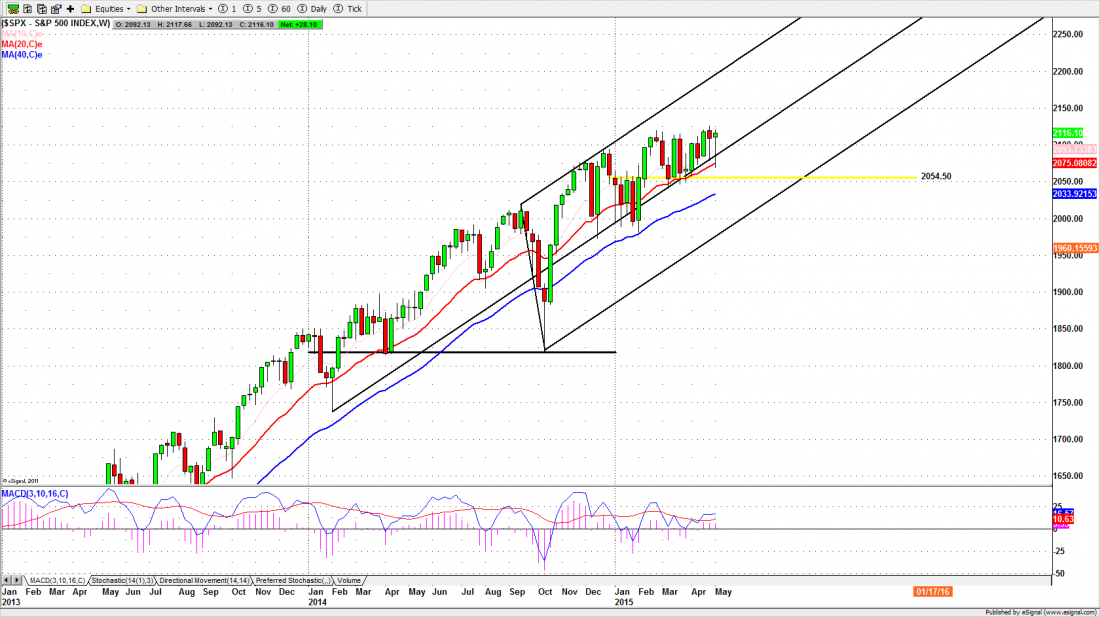
The S&P500 cash index, the index of large-cap US equities, closed at 2116.10 on Friday, a small net loss in a week that was marked by wide price swings. The market has been careening from the top to the bottom of a fairly narrow range for most of this year; the SPX last week conformed to that pattern.
The index has made a series of short-term whipsaws inside the 2040 to 2125 range, but most of those gyrations are just noise. For the long term the situation is clear: the uptrend is intact and remains strong. The long-term chart speaks itself.
Since the index made that historic low at 666.74 in 2009, the Fed has injected huge quantities of free money into the economy and the markets, and by April, 2013, the index had fully recovered the loss incurred in 2009. For at least the past two years US equities have been in a true bull market, still largely fueled by the Federal Reserve.
The basis point for this bull market is around the 1570 level. The current target, 2136.50, is just a point where we should expect some profit-taking. The final destination for this bull should be in the 2485 area, and it may take us another year or more to get there.
The range from 2125 to 2040 level, where we have been rocking back and forth since February, is essentially a brief resting place where the investors who entered around 1570, 1770 and 1850 will lock in partial profits.
The key zone is the yearly pivot around 2055-45. As long as any short-term pullback doesn’t break that level, the buyers will continue to show up. And the longer the index holds in that range, the stronger the explosion later.
This week
This week there is relatively little in the way of economic data to be released, and the index could extend its rally from last week. The question is can the Bulls break through the overhead resistance lines, or can the Bears find a reason to move it back down into the trading range. Monday’s price movement should give some hint about the direction of the next move.
Last week SPX sold off in the early days of the week and bounced strong on the last two days. The price action was strong. If there is a follow-through on Monday it should take the index to new highs.
There is a “W” pattern on the weekly chart with the neckline lying around the resistance at 2125. A move above the 2125 level could push the SPX up to 2135-2150.
A failure to break the neckline could lead the price back near the momentum support in the 2100-2090 area. But any pullback may be very brief. As long as 2100-90 holds the index up, the rally will resume again.
Futures
The ESM, the current contract for the S&P500 mini-futures, closed Friday at 2108, about 22 points above the previous close. It gapped up strong at the open, made a good rally, and closed high on good volume. The price action was strong all day.
That opening gap on Friday could be established as a breakaway gap, indicating a continuing rally, if there is some follow-through today (Monday). We’ll be looking for a break above 2123.50-2124.50 this week to trigger a pattern breakout with upside momentum. The price could then be pushed up to 2133.50-2135.75 or higher.
A failure to breakout could lead ES to pull back near 2102-2100 or lower to 2096.50-95.50 (long entry).
Today we need to see a signal after the first hour of the day session, indicating either a price reversal or a continuation move. Our traders should follow the signal to decide the direction for short time-frame trades.
Major support levels for Monday: 2085-88, 2070.50-75.50, 2062.50-64.50, 2045-50;
major resistance levels: 2115.50-19.00, 2121.50-24.50 and none.
###
For an Exclusive Free Weekly Analysis of US equity indices, click here
Related Reading:

