

The gold market has traded sideways to lower in a $200 range since mid-2013. Typically, one would think there’s little opportunity for money to be made in a market with this type of meandering, non-trending action. However, this is exactly the type of market that commercial traders love. As value players, gold producers hedge their forward production in the futures markets when prices rise. Meanwhile, end line gold consumers use the futures markets to purchase their future input needs by buying at below value prices. Based on their models, business and policy connections, their assessment of value is typically pretty spot on.
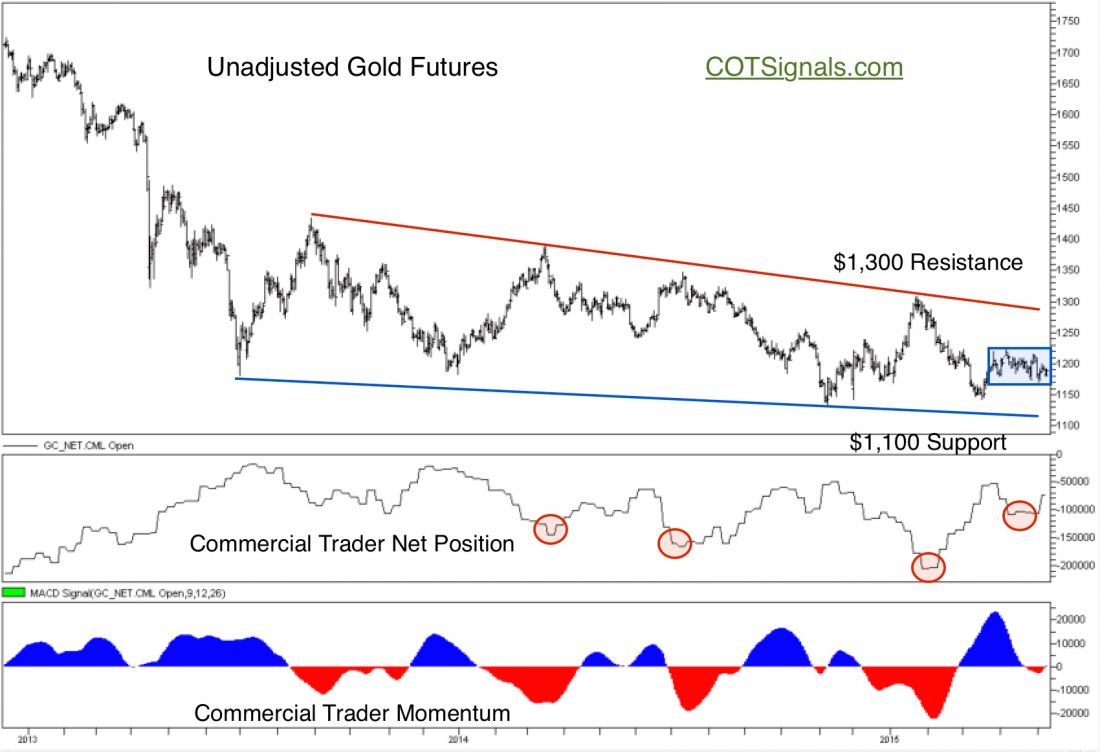
This week, we’re going to look at the bullish change in their sentiment, why and what it may cause to happen. First of all, look at the chart below and notice that over the last two and a half years the commercial traders in the bottom pane have been buyers on every decline and sellers on every rally. Also notice that their net position has remained negative throughout this period. Every market has its own unique character. Part of the gold market’s unique behavior is that the net commercial trader position rarely turns positive on an outright basis. In fact, the July 2013 purchases brought their net position to negative 19k contracts and that was the closest to neutral since December of 2001. Therefore, we also track the momentum of the commercial traders’ net position. What we really want to know is how compelled they are to take action at a given price level.
The current trading situation may be triggered by the shift towards positive commercial momentum. The recent commercial buying may have been fueled by the recent actions and statements of Janet Yellen and Bill Gross as their comments have sent the bond and currency markets into a tailspin. Both of these factors make the recent highs in the Dollar and bonds seem more meaningful. The less attractive the Dollar becomes, the more quickly we’ll begin to see gold rally again. Finally, notice how much less selling they did on the market’s last decline as highlighted by the circles on the chart.
Finally, this brings us to timing the trade and protecting capital in case this market continues to go nowhere. Therefore, we’re looking at the smaller patch of consolidation that has built up since the March lows and is bounded by $1,225 on the high side and $1,168 on the downside. We believe the recent shift towards a more bullish stance by the commercial traders could provide the spark for this market to breach the $1,225 resistance and make a run near the significant resistance near the trend line at $1,300. Given a breakout to the high side, a protective stop should be placed at the consolidation’s low of $1,168 initially.
###
To Leverage the Resources of the World’s Biggest Traders, Click Here
Related Reading:

