

Finding the trend is arguably one of the most important aspects of a technical trading strategy. If a trader can find the direction of the trend, it can exponentially increase the likelihood of having a successful trade. Trend traders have particularly enjoyed a continued bull run for the USDollar into the 2015 trading year. Prices have advanced in 8 out the last 10 months, allowing traders many opportunities to implement the trend trading strategy of their choosing. However, as the trend has matured and prices have closed lower for the month of April, some traders have become wary of initiating new positions.
Today we will examine the USDollar trend, and see if there are any signs of a reversal on the horizon. Let’s get started!
Spotting the trend
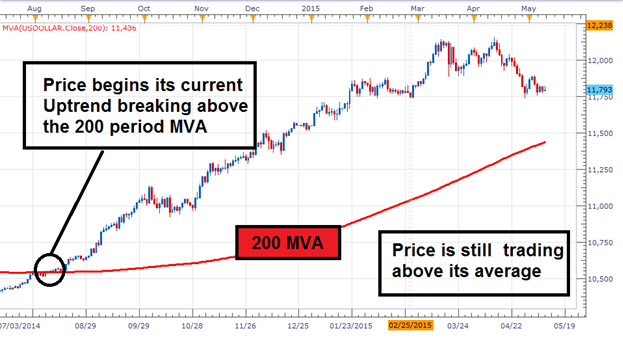
One of the easiest ways to decipher the trend is through the use of a 200 period MVA (Simple Moving Average). The idea being that if prices are advancing faster than the MVA, the underlying asset is in an uptrend. In August of 2014, the USDollar passed above its 200 MVA, and at that point started its current advance towards higher highs.
Looking at today’s prices, we can see that the USDollar is still traveling well above its 200 period MVA on a daily chart. Even despite its decline off of 2015 highs, the pair has yet to trade back below the average. Just as traders judged a shift in the trend in August 2014, today prices would need to decline below the average at 11,430 prior to saying that the current uptrend has ended.
Higher highs, or lower lows?
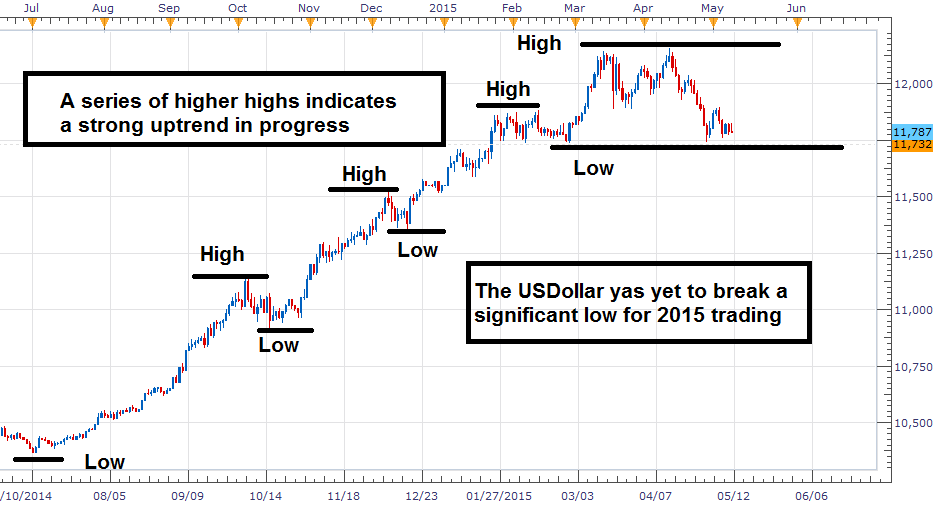
When a trader is analyzing an uptrend, there are a few simple truths that cannot be compromised. In an uptrend, the underlying asset must make a series of higher highs and higher lows. If these qualifications are not met, price action analysis suggests that current market conditions may be shifting. So how does this look with the USDollar.
Taking a closer look back at our daily chart, we can see the USDollar advancing to a series of higher highs. This has culminated in a new high for 2015 at 12,162. This move is in line with a classic uptrend. However, from this point prices have currently begun to decline and test one of the previous areas of price support. In the event of a breakout to a lower low, this would begin to invalidate our definition of an uptrend. As well, if prices neglect to bounce towards a higher high, this would again suggest a change in market conditions.
Oscillator Reversal
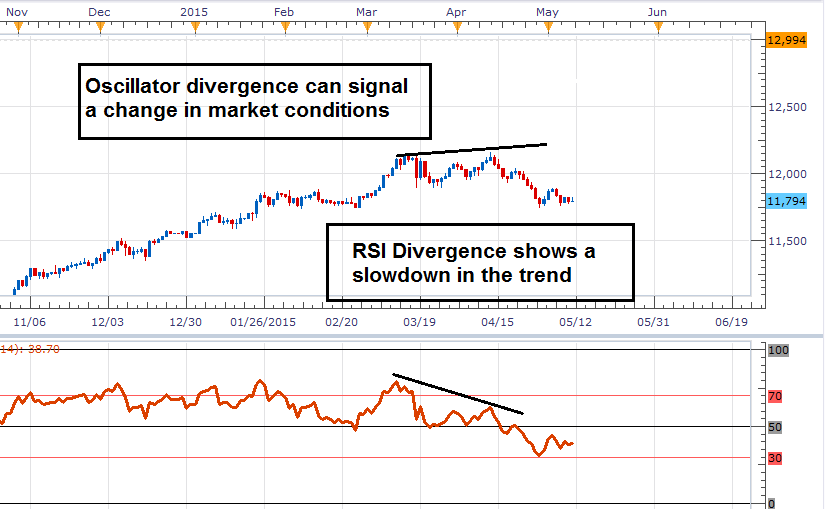
Technical oscillators, such as RSI (Relative Strength Index) can be used to identify reversals in the trend. While traders traditionally look at overbought and oversold signals, divergence implies that there is a separation in direction for the indicator relative to price. These diverging signals normally indicate that a trending markets strength is waning, and can proceed changes in market conditions. It should be noted that markets may diverge for extended periods of time. This is why divergence is normally coupled with other forms of technical analysis before a trend change is declared.
Going back to our daily chart, we have seen significant RSI divergence on the USDollar chart. We can clearly see prices advancing, while the RSI indicator begins to decline. This divergence may be a clue that a reversal may occur at some point in the future, but it doesn’t necessitate that a complete trend reversal is imminent. Knowing this, it is best to now look at divergence along with all of the evidence we have previously collected.
Conclusion
When it comes down to trend identification and spotting reversals, traders must rely on the evidence they can prove. Let’s review what we have learned so far.
- Price is over its 200 period SMA
- No significant lows have been made, No new highs have been made
- RSI is diverging, suggesting momentum for the USDollar is slowing
So how can we use this information as traders? Price is no doubt retracing for the USDollar, but using our technical tools, it is too early to say the trend has completely turned. Traders can use these retracements as opportunities to trade market swings, or even look to initiate new orders on breakouts back in the direction of the primary trend. In the event that a reversal does occur, trend traders should take the signals of new lower lows, market divergence, or a break in the 200 MVA as an opportunity to change their bias in the markets new chosen direction.
###
For More from Walker England and to Receive Daily FX News, Click Here
To Learn about Trading the Gray Box in Currency Trading, click here

