

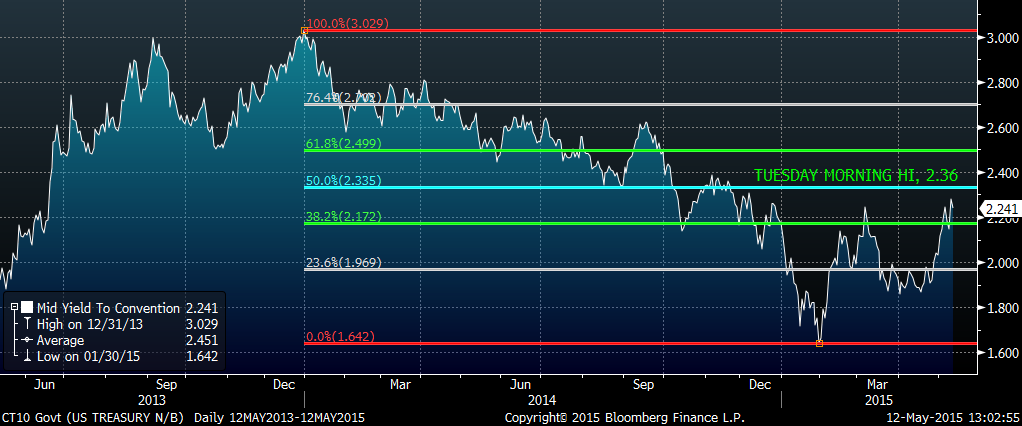
It took 13 months for yields at the long end of the treasury curve to move from the highs set at the end of 2013 to the lows marked at the end of January 2015, and just 3 and 1/2 months to retrace halfway back. (See chart below). The sell off in the long end the past month and a half has been significant, both in the US and in other fixed income markets across the globe. For example, the German ten year bund yield has leapt from 7.5 bps to 67.5 since the middle of April. The question is whether this is the beginning of a much stronger move to higher yields.
On Tuesday, both the ten year and thirty year bond cash yields just barely pierced their 50% retracement levels in the morning, and faded back from there. In tens, the high was 3.03 to a low of 1.64, with 50% at 233.5. For now, this retracement level has capped the yield surge. However, the market has taken on a decidedly more bearish quality in several ways. First, volume is tending to increase on moves down. Treasury futures are moving down much more easily (and faster) than up. Implied volatility is increasing on the move to higher yields. In short, the market is perceiving ‘fear’ of higher yields. Never mind the fundamental reasons for a minute, just realize that the technical signals are bearish.
For a long time the fundamental reasons for yields to remain low at the long end were clear. Global yields are quite low, making US bonds an attractive place to invest on a relative basis. The employment market, while having improved, still isn’t robust, (according to the Fed). Inflation is low, punctuated by the six month slide in oil from August of 2014 to the beginning of this year. And the powerful rally of the dollar from July 2014 to March 2015 had, in a way, imported deflation onto US shores. However, several of these factors depressing US rates have been starting to change. Global yields are perking up. The employment market appears stable in spite of problems in the energy sector. Oil has had a solid rally the past two months. Year over year comparisons in the price of energy are certainly going to begin to show positive changes going into the end of the year, boosting inflation readings. The dollar index put in a double top this year and seems to want to edge a bit lower, removing disinflationary pressure. On top of that, both China and oil exporting economies are dipping into reserves, i.e. selling US treasuries, in order to plug gaps in domestic budgets.
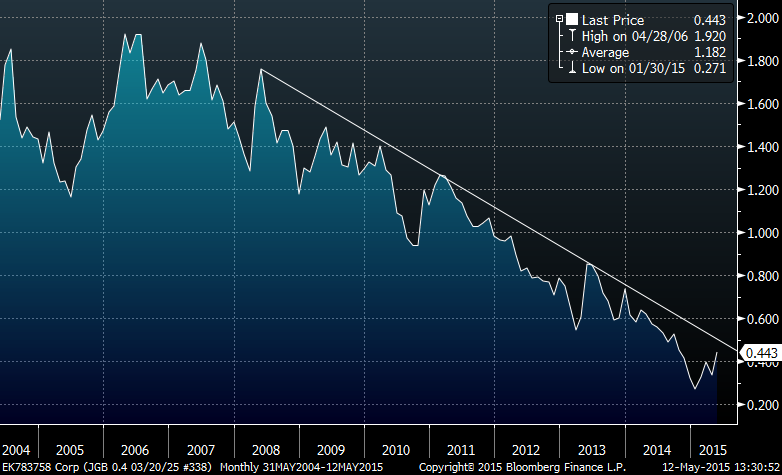
Is there is more to it? For a long time many analysts have suggested that excessive gov’t debt would eventually lead to higher rates. It hasn’t happened. But what if the market is beginning to sense a change in trend with regard to confidence in monetary authorities and their QE policies? Observe the long dated chart of Japanese ten year yields. Since 2006 the Japanese ten year yield has been dropping. A long term downward sloping trendline in place since 2008 comes in only about 7 bps higher than the current yield of 43 bps. When $/yen finally broke its long term trendline, it rallied with a vengeance. Could it happen with yields?
The point is that the market has become complacent about long term sovereign yields, and indeed about long term corporate funding rates. Long term yields are strongly correlated globally, especially in developed markets. If the market is beginning to question the sagacity of global central banks, it will show up in bond yields. Just something to bear in mind.
###
To Read more from Alex Manzara, click here
Related Reading:

