

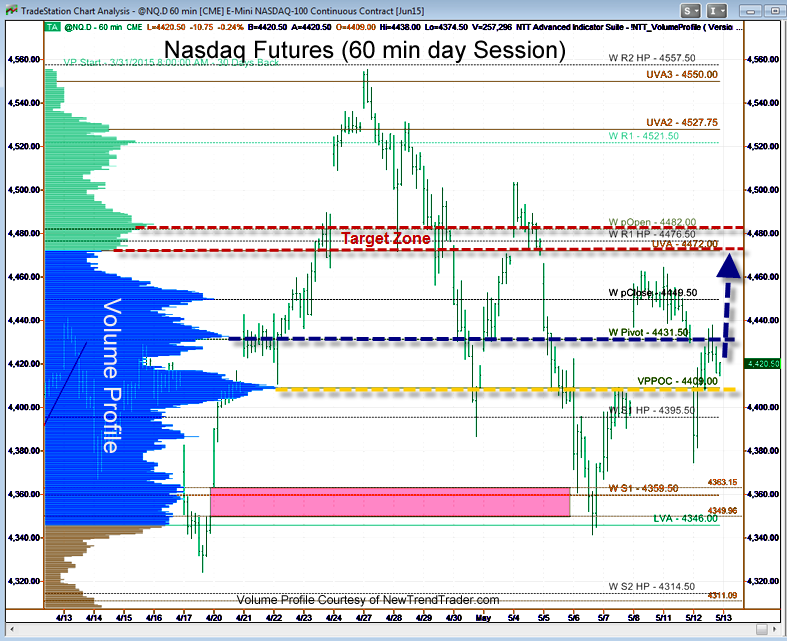
As noted yesterday, the Nasdaq is in gap fill mode and bulls ended Monday’s session facing a brand new gap at 4409, which also represented the Volume Point of Control on this 30-day profile. That made it a powerful magnet.
Just how powerful?
Overnight, drama in the bond market caused the Nasdaq futures to open precisely at our 4409 target. After the obligatory undercut, the Nasdaq was able to claw its way back to a positive finish and in the evening session the bounce is continuing.
This bit of technical housekeeping puts the NQ in good shape for a continuation up to the next resistance level marked in red on the Volume Profile chart, which lies at the Upper Value Area (UVA) boundary.
A Note on Volume Profile
The histogram on the left side of the chart shows the volume distribution in the Nasdaq futures for different periods of time. Key support and resistance levels are indicated by the peaks and troughs. If you would like to receive a primer on using Volume Profile, please click here: www.daytradingpsychology.com/contact
###
Don’t miss an exclusive webinar on May 26th at 4:30pm ET with Dr. Kenneth Reid Ph.D. that can change your trading and your life. A free Personality Test. To register, click here

