

On Wednesday the Nasdaq futures gapped up, but the gap-fill police made sure that the exuberants paid the price by the end of the day. This same-day gap fill action is bullish in my view; an act of good housekeeping.
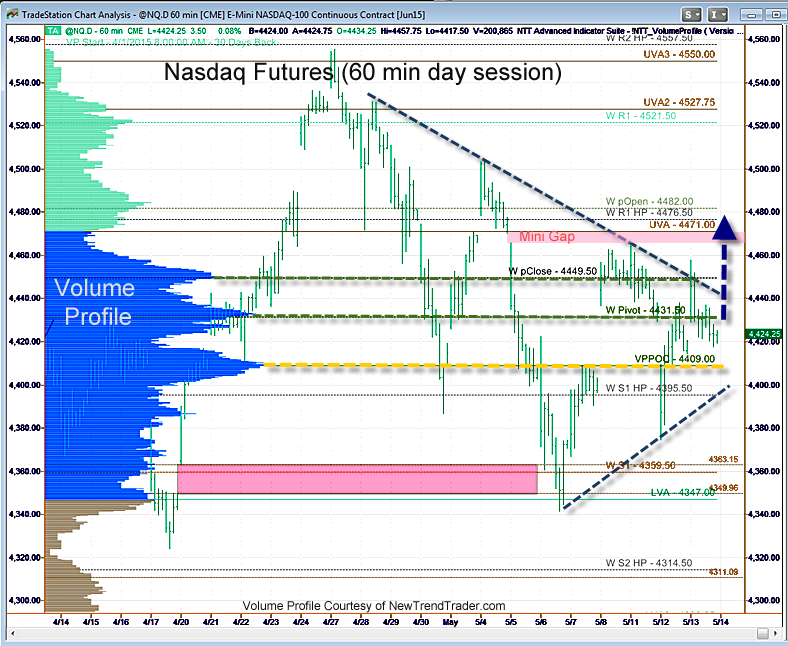
What’s interesting about the 60 minute day session chart is not so much the three High Volume Nodes, which are abundantly clear, but the compression pattern in the overall index that has formed a narrowing symmetrical triangle. This is a stock pattern not often seen in futures, but there it is.
There is a mini-gap at 4470 that beckons the housekeeping crew along with some Weekly Pivot levels in that same area. Remember, markets like to rally on bad news.
A Note on Volume Profile
The histogram on the left side of the chart shows the volume distribution in the Nasdaq futures for different periods of time. Key support and resistance levels are indicated by the peaks and troughs. If you would like to receive a primer on using Volume Profile, please click here: www.daytradingpsychology.com/contact
###
Don’t miss an exclusive webinar on May 26th at 4:30pm ET with Dr. Kenneth Reid Ph.D. that can change your trading and your life. A free Personality Test. To register, click here

