

Crude oil has been drifting lower in fits and spurts for the majority of the month of May after a very strong April, which saw prices climb out of the 40’s and nearly touch $60/barrel by the end of the month.
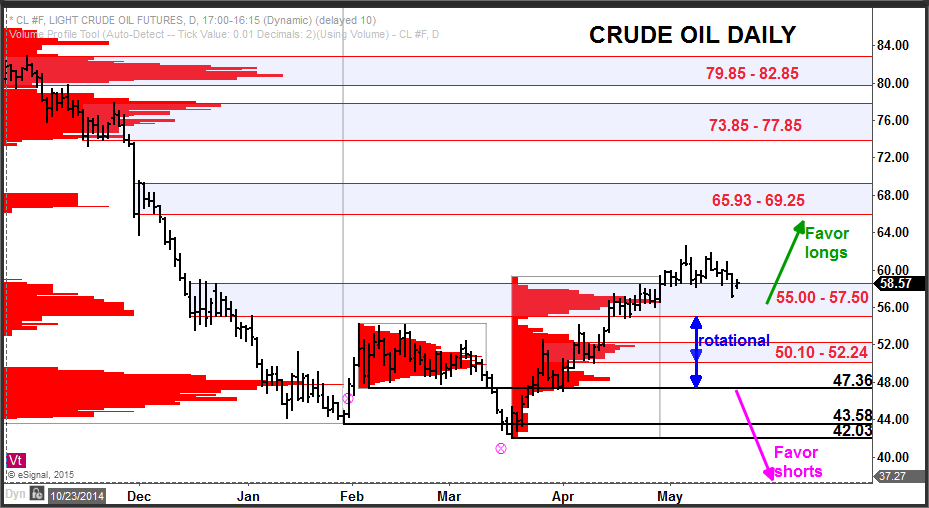
The chart below is showing volume-at-price information, which is displayed as a histogram on the vertical axis to allow the reader to see what prices have seen the heaviest traded volume. This information can be used to establish important price levels (support and resistance) and to determine trend information.
Currently, the pullback into the 55.00 – 57.50 would seem to be a buying opportunity for a continuation of the rally that began at the March low. Holding this support zone and continuing higher would next target the 65.93 – 69.25 zone.
There are additional levels of support and resistance defined on the chart established by the ‘high-volume areas’, which are the areas of price where there has been the greatest accumulations of volume in the past price record.
Using volume-at-price information in this way is particularly valuable in establishing a technical outlook on any market as it uses market generated information and keeps a trader in synch with what the market is doing. It is a very robust tool due to its applicability across all degrees of time.
###
Do you want a FREE VIDEO where expert advisor to Wall Street Aaron Uitenbroek reveals the exact methodology that launched a career delivering his brand of market analysis and trading insight into the hands of the world’s largest investment banks and the Wall Street elite? Click here

