

After some late afternoon profit-taking on Wednesday, the stage was set for a nasty megaphone pattern on the 60 min NQ chart, which would resolve down at the Weekly Pivot (4456).
The only thing standing in the way was support from a High Volume Node at 4489 (red dashed line on the chart.) On Thursday, the opening 30 minute bar tested this critical area and it held. That was an all-clear signal for the resumption of the uptrend, as indicated by the blue dashed channel.
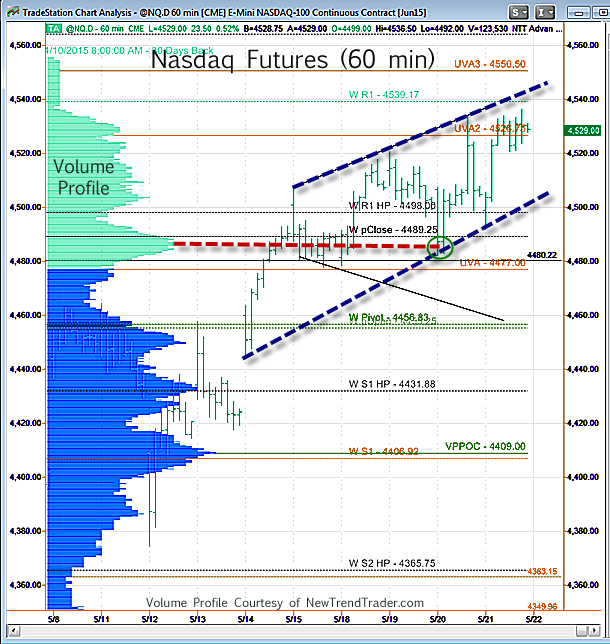
This suggests that the Nasdaq will now play catch-up with the senior indices and make new highs.
A Note on Volume Profile
The histogram on the left side of the chart shows the volume distribution in the Nasdaq futures for different periods of time. Key support and resistance levels are indicated by the peaks and troughs. If you would like to receive a primer on using Volume Profile, please click here.

