The S&P 500 (SPX) had a pretty interesting week in the run-up to the Memorial Day holiday. It made a new all-time high at 2134.72, and it closed Friday at 2126.06, the first time it has managed to close above the high set in April. That’s the good news.
The bad news is that the range for the week was extremely narrow — roughly 14 points, which is hardly a decent range for a single day — the momentum was very weak, and the volume was very low, as it has been for most of this month.
We got up there, but we didn’t run up to the top of the mountain, by any standard.
We have to regard the results last week as encouraging for the Bulls. It seems clear that the Bull market is still moving forward, and the rally is continuing, inch by painful inch (last week’s gain was a tiny 0.1% above the previous week’s close). We haven’t seen anything that says the uptrend will not go on and on and on. Forever.
Warning Signs
Except that it always ends somewhere. And while the long-term remains bullish, there are a few signs we could be reaching a shop-term top:
• The VIX, the market volatility index, is low and staying low — 12.13 at Friday’s close. The VIX is an inverse indicator of investor sentiment; when it is down, investors want to believe that the good times will never end, and the further down it goes the more bullish they become, until everyone is all-in. When there are no Bears left to capitulate, where will the next buyers come from?
• Market sentiment indicators, both the “smart money” and the others, are also bullish. For example, the Investors Intelligence survey last week turned up 50% Bulls versus 15% Bears. And the National Association of Active Investment Managers — the guys who invest other people’s money — says its members have almost 70% of assets invested in US equities. There’s some cash still sitting on the sidelines, but not that much. And when it goes …
So pretty much everyone is thinking the same way. And when everyone thinks the same way, they are usually wrong.
This Week
This is a short week, because of the Memorial Day holiday (hope you had a good long weekend) and it is also the last trading week for May. Typically the end and beginning of the month is a bullish period.
We have a boatload of economic reports being released today (Tuesday) including Durable Goods Orders, New Home Sales, PMI services, Consumer Confidence, and the Richmond Fed manufacturing index. Any or all could move the market around and create volatility.
The market has been holding above a significant support level, 2125, for the last five days. That is the neckline of the wedge pattern on the daily chart, a broken resistance level that has now become support. As long as that support holds, the odds will still favor the upside.
The next resistance is likely to be around the 2135-50 area. There are lots of Call options outstanding at that level and that could create a ceiling for this week. A failure to break the ceiling will be followed by a pullback.
Our model shows the closing price for the month should be above 2106, and quite possibly near the high end of the monthly range. Given historic trading patterns, that high or the high set last week should be the top for the first half of the year.
E-Mini Outlook
On Friday the S&P 500 mini-futures made a narrow range inside day, a reflection of traders’ lack of interest before the long holiday weekend. Today (Tuesday) they are back at work, sunburned and beer bloated, and the market is quite likely to thrash around, especially in the pre-market and the first hour of the day session, before they settle down.
The futures have been consolidating above the support around 2119 all last week and some kind of move away from that area is likely today or tomorrow. A failure to hold above 2112 could drop the price back to the 2100 level. On the upside, we are likely to see a slow grind up if we can’t find some previously inactive group of enthusiastic new buyers to get this pig airborne.
Major support levels for Tuesday: 2103-06.50, 2093-90.50, 2085-88, 2070.50-75.50
Major resistance levels: none established yet
To receive free market insights with actionable strategies from naturus.com, click here
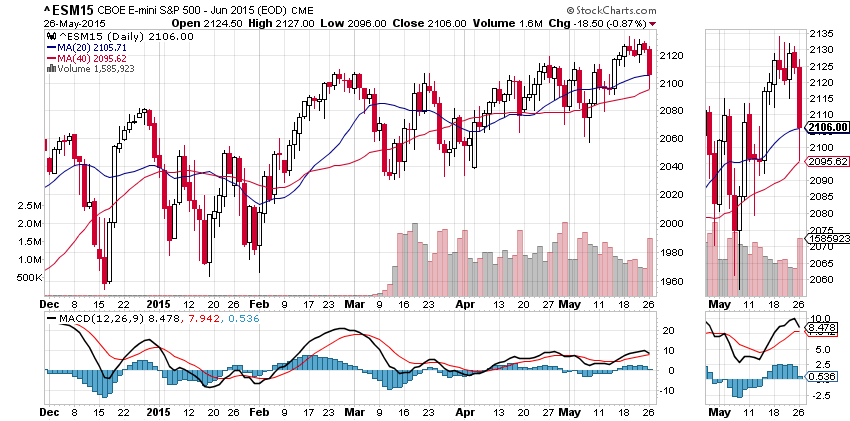
SPX Daily chart, May 22, 2015