

Both the Nasdaq Composite and the Nasdaq 100 are probing new high territory, while the major indices look tired. Institutional funds have been flowing out of U.S. equities since the first of the year, which accounts for the choppy and lackluster performance of the major indices (the S&P is up 3.6%).
That said, most institutions don’t invest in small caps or the Nasdaq 100, which is perhaps one reason these two indices continue to be tradable. i.e. they can generate multi-day trends.
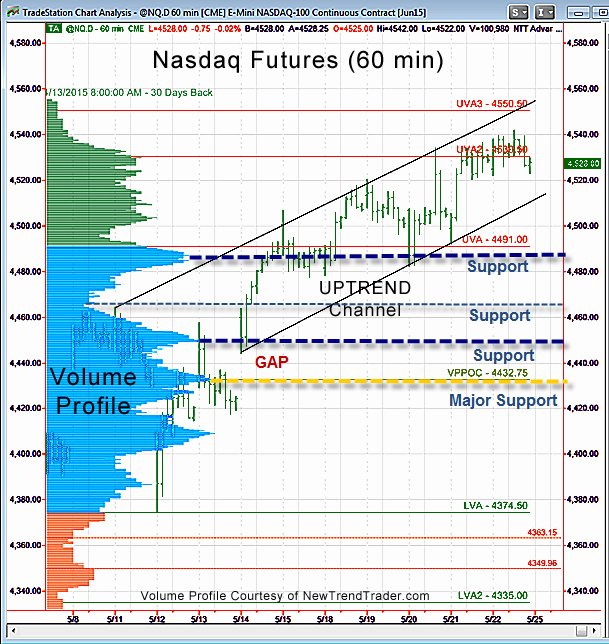
At the moment the trend in the NQ is up. If gravity reasserts itself this week, we have key initial support at 4485-4491, a level that was tested on May 14, 15 and 19. In other words, it’s important. You can see the other key High and Low Volume Nodes (dotted blue lines), which define a support ladder, below that.
Eventually, the large gap at the Volume Profile Point of Control (4432) will be tested; it’s only a matter of time. But, of course, timing is everything.
A Note on Volume Profile
The histogram on the left side of the chart shows the volume distribution in the Nasdaq futures for different periods of time. Key support and resistance levels are indicated by the peaks and troughs. If you would like to receive a primer on using Volume Profile, please click here: www.daytradingpsychology.com/contact

