In Tuesday’s article we warned that a short-term retracement was likely. In Tuesday’s trading, we got it.
The S&P 500 mini futures (ES) not only broke below the 20-day moving average, it dropped even lower to the 40-day exponential moving average (ema), and was heading lower still until the customary 3:00 pm rally into the close left it with a modest bounce. The market looked naked, clinging desperately to the faded hopes inspired by last week’s rally.
It was crying time for the bulls. The market started down when the European desks opened, struggled back a bit for the US open, then fell like a stone on heavy volume. The close was 2105, an important support level that has been in play for several weeks, but fully 27 points below the bright shiny new high it made last week. Even the slow-moving MACD indicator came within a whisker of putting out a selling signal.
The decline took the market right through the psychologically-import 2100 level. Even though it recovered a bit for the close, a couple more days like that could do some real damage. There’s going to be a lot traders thinking about packing it in for the summer. We can always come back after Labor Day.
Today
We may see the futures make a consolidation area today (Wednesday) back and forth between the 20- and 40-day ema’s, especially in the early sessions. If the 2095 level holds in overnight trading we may even seen a bounce later today,
But if 2096 can’t hold the price up, there’s a good chance for a further decline below Tuesday’s low to try and fill the gap that has been sitting at 2093.50 for many days. In any case a pullback below the broken resistance/consolidation range will not be a good signal for the buyers.
On the upside, the 2119.75-2115 zone should act as an immediate resistance zone for today’s trading. ES needs to go above it to maintain the bullish outlook for the coming days. Otherwise, a further limited correction should be expected.
But the key word is limited. This isn’t the big crack in the market we’ve all been worried about. At least not yet.
Major support levels for Wednesday: 2092-89, 2081.50-79.50, 2062-59.50;
major resistance levels: 2032-36.60
To receive free market insights with actionable strategies from naturus.com, click here
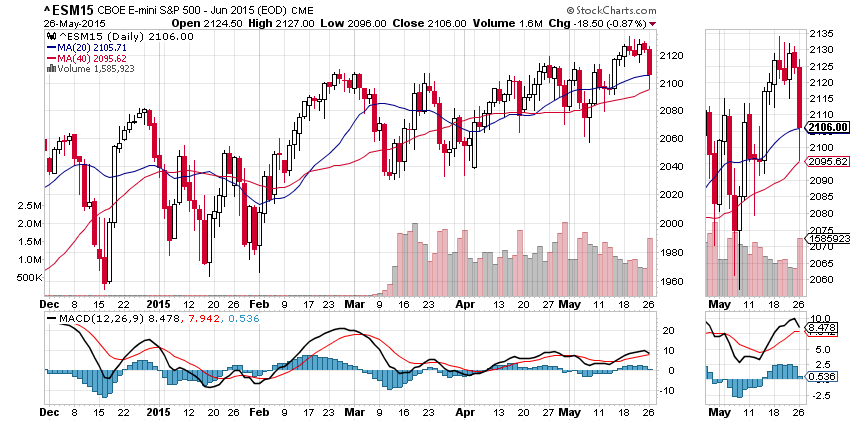
Chart: ESM5 daily chart, May 26, 2015