

I have been wondering when the big gap test would finally start… and Tuesday was the day.
In yesterday’s review and forecast I indicated that key initial support was at 4485-4491. On Tuesday morning we quickly took that level out and then ended the day with a perky bounce that is likely to retest that level from below. So, at this time, what was recently key support is now important resistance, as marked on the chart with a red dashed line.
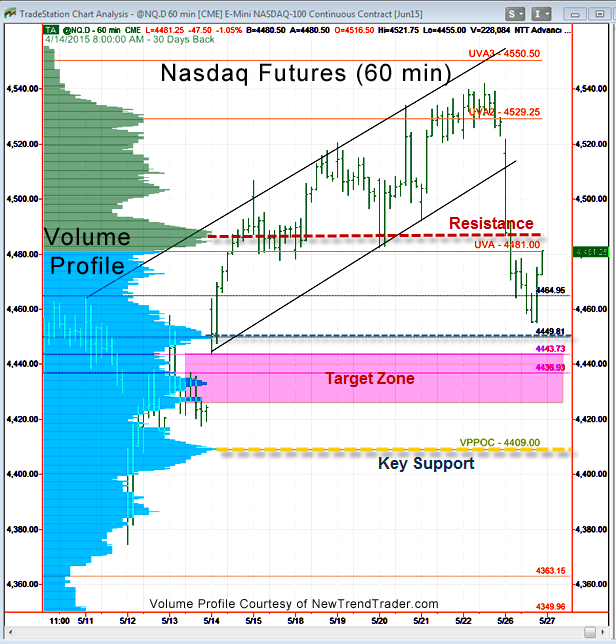
The ultimate target, however, is the large gap zone that extends from 4444 down to 4425. Given the strong initial momentum of this down-move, a test of the Volume Profile Point of Control (VPPOC) at 4409 is likely.
A Note on Volume Profile
The histogram on the left side of the chart shows the volume distribution in the Nasdaq futures for different periods of time. Key support and resistance levels are indicated by the peaks and troughs. If you would like to receive a primer on using Volume Profile, please click here.

