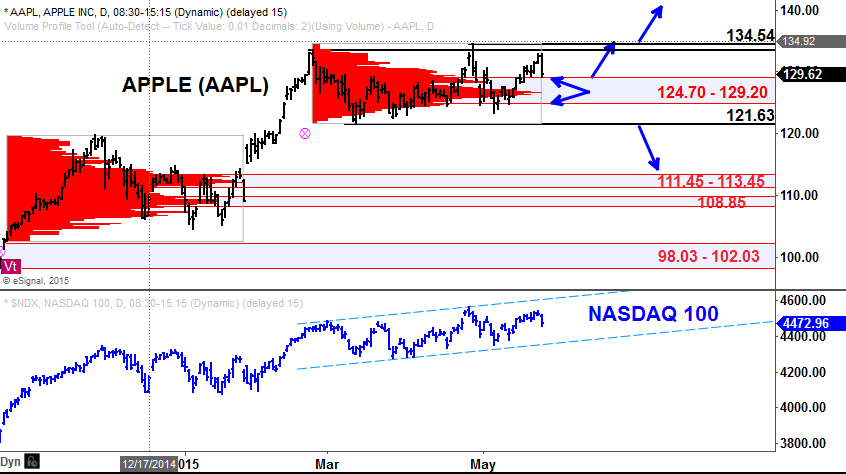
Since its high in March, Apple has been moving in a sideways consolidation with highs at 133.50 – 134.54 and lows at 121.63 – 122.50. Over the same period of time the Nasdaq 100 ($NDX) has been stronger, showing an upward sloping channel. This relationship could easily change based on Apple’s resolution of its current consolidation range.
The volume-at-price histogram in AAPL reveals the current high volume area at 124.70 – 129.20. If the current test to 129.20 is met with buyer interest such that prices rebound quickly back toward the highs, this would be a first indication of a potential breakout to the upside.
Conversely, if price is attracted back to this 124.70 – 129.20 area of high volume and spends considerable time trading within this range, this would be an indication that prices will not be making any sharp moves just yet.
With the relative maturity of this consolidation, having been in development since the beginning of March, it is prudent to begin anticipating an upside resolution while above the current high volume area and favoring an eventual downside resolution if below it.
Volume‐at‐price is valuable tool similar in some ways to Market Profile, which utilizes time‐at‐price. Volume‐at‐price is displayed as a histogram along the price (vertical) scale and builds across the chart as traded volume occurs at each price. This view is sometimes referred to as a volume profile or volume‐at-price.
Volume‐at‐price analysis provides valuable information about what prices have seen the heaviest institutional interest and can give insight into where the smart money is accumulating and distributing. While traditional indicators are often simply derivations of price information, volume‐at‐price provides unique additional information that is not available to traders only using traditional technical analysis methods.
By applying volume profiles to specific areas of the chart, information can be drawn out of the price action identifying areas of support and resistance as well as trend information.