

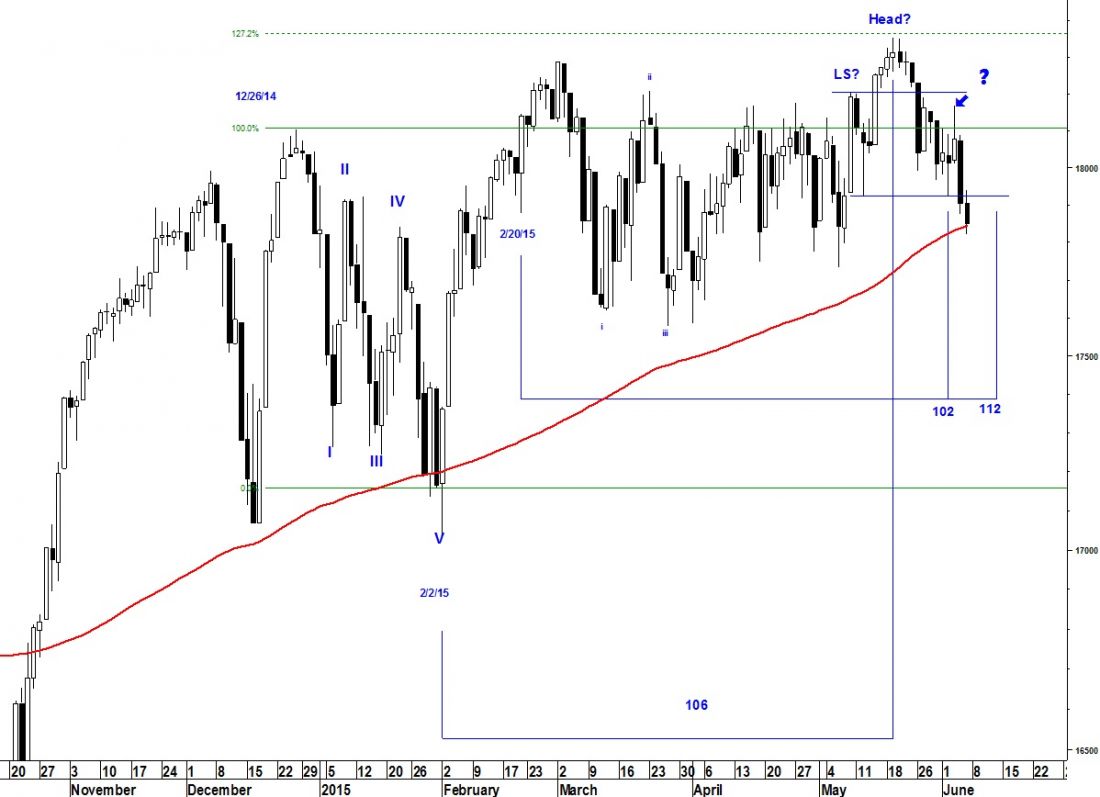
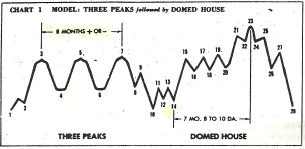
Taking a fresh look at the Three Peaks/Domed House chart recently I had a “funny” thought. In the current pattern, the May 19 high reached 127.2% of the Jan decline (the final high of this pattern has always been a Fibonacci relationship to the extent of the decline during the First Floor Roof). There’s no reason the Dow can’t rally to a higher Fib ratio but the May high is an almost perfect 107 day interval from the Feb low. What if the top of the bull market is already behind us?!!! Lindsay’s template calls for a final head-and-shoulders topping pattern and a potential pattern can be seen on the daily chart below.
The neckline of the Head-and-Shoulders pattern was broken on Thursday but we can’t forget that the high may come more in tune with the cycles in the Dollar and commodities later this month. A 107-day interval from 2/20/15 will expire on June 12 but a break of the 150-dma (Friday’s close) will make any higher high unlikely.
Try a sneak-peek at Seattle Technical Advisors

