The S&P 500 cash index ($SPX), the large-cap index for US equities, closed at 2092.83 last Friday, up 1.28 points for a tiny net weekly gain. But it took a 43-point move to get there.
The index was down 20 points on Monday, up 43 points on Wednesday, and down about 20 points on Friday, to end the week essentially where it began. Lots of noise, no progress.
This is the lead-in to the end of the first half of the year. So far in 2015 the large-cap index is up 1.74% from the 2014 close, a walloping 36 points. Calling this a lackluster performance is too kind. There are lots of ways to make money in this market, but buy-and-hold has not been one of them so far this year.
This week
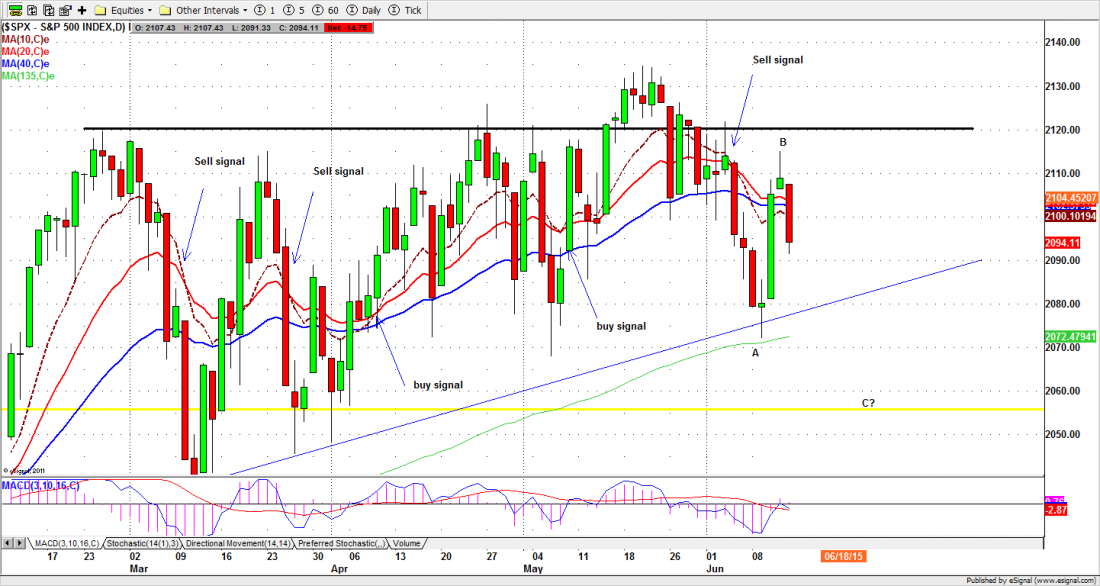
The mid-week rally quickly reversed to form a doji pattern for the week (See chart). That’s a sign of indecision and there is a lot to be undecided about.
This is a quadruple witching week, when index futures, index options, futures options and stock options all expire more-or-less simultaneously. We also have a Fed Open Market Committee Meeting on Wednesday, followed by a presser from the Chair, Janet Yellen. And the Greek debt drama looks to be entering the endgame stage. The combination is enough to make the market act crazy this week; it’s a good time to watch the action from a safe distance.
If you really want to enter the casino here’s a couple of things to watch:
- The index has been held below the 2120 level since February of this year, except for one quick rally which was quickly erased in late May. Wednesday’s rally may be the same kind of fake. But as long as the price stays above the 2055-50 zone, the index is just making a short-term adjustment, not a long-term change-in-trend.
- On the daily chart there is an ultra-short-term selling signal. There are additional bearish signs. One is the “M” pattern we talked about last week. The second is a potential A-B-C correction pattern. The next C low should go lower toward the 2050 area.
- As long as the index stays under the 2100 level, this week we are likely to see an attempt to challenge the short-term support around the 2072 level.
E-mini futures
The ES, the S&P500 mini-futures (ESU5) closed at 2085 on Friday. Based on the closing price, ES remains in a short-term downtrend, and last Thursday’s high could be the B top. A break below 2080 should lead ES toward the C low destination around the 2049-50 zone.
Today (Monday) 2080-78.50 is a key level. A break below it could lead ES down to retest the 135-day moving average line at 2068. ES could then follow the “M” pattern down further toward 2055 if the price closes below 2068.
But it also could move back up to repeat last Friday’s range and re-test 2100-95 if the 2080-78.50 zone holds up during overnight trading.
Major support levels for Monday: 2070.50-68.50 , 2064-62.50, 2053.50-50.50;
major resistance levels: 2107-06.50, 2122-25, 2134-36.50