

The Bulls have had several opportunities to recover the football they fumbled over the last few days, including a surprise rally-on-“bad news” after the Fed announced rates are indeed going up this year.
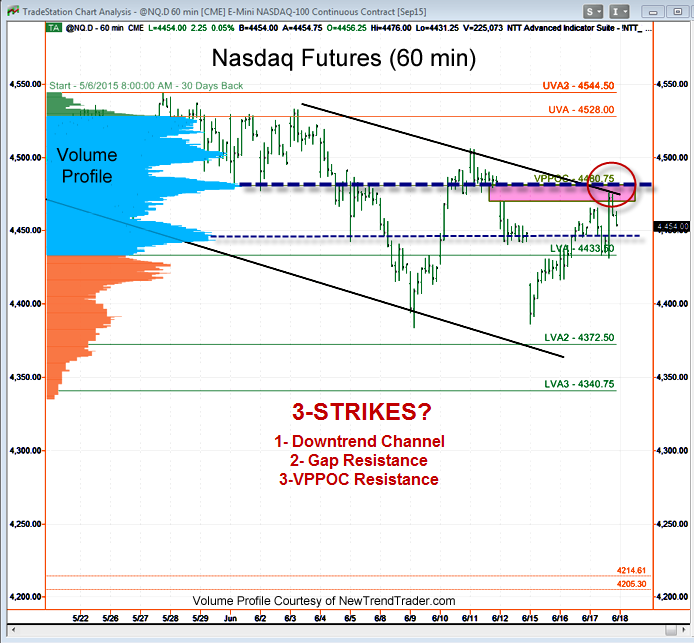
Unfortunately, the sharp rallies are starting to look like typical down-trend behavior. In other words, they move off the lows very suddenly, but can’t break through downtrend channels (see chart). Reinforcing the bear case is the failure on Wednesday to close above the 6/11 gap (magenta rectangle).
For Volume Profile fans, the upper level of that gap happens to be the Volume Profile Point of Control (VPPOC) at 4480.75, which reinforces its role as resistance.
If you look closely at the lower right of the chart you will see two thin red lines (4214 & 4205), which denote another unfilled gap in the Nasdaq futures. Unfortunately, we need to keep that level in mind as a target.
A Note on Volume Profile
The histogram on the left side of the chart shows the volume distribution in the Nasdaq futures for different periods of time. Key support and resistance levels are indicated by the peaks and troughs. If you would like to receive a primer on using Volume Profile, please click here

