

There’s nothing more bullish that a failed bearish pattern. The Bulls did a good job of disguising their intentions this week, feigning weakness until the opening bell on Thursday. Then we had the highest volume up-day in three months, which pushed the small cap Russell 2000 to new all-time highs.
The market stampede broke through a downtrend line on the Nasdaq 100’s daily chart, as well, which recruited swing traders into the bull’s camp. The larger the new cohort, the further the trend is likely to run.
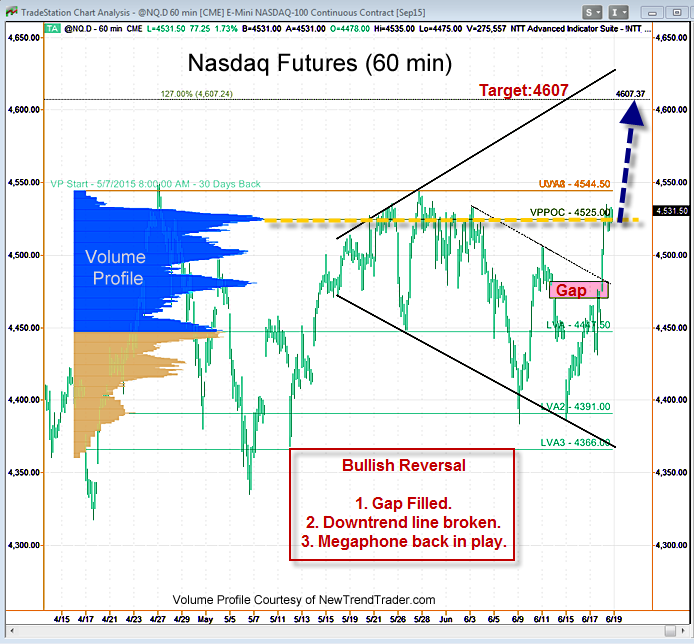
The volume surge pushed the Volume Profile Point of Control (VPPOC) up to 4525. The NQ may need a few days to consolidate and digest this high volume node, but the initial upside target is the 127% Fib extension at 4607. If the megaphone plays out, the NQ will eventually intersect the upper megaphone extension. That could take a month or more.
A Note on Volume Profile
The histogram on the left side of the chart shows the volume distribution in the Nasdaq futures for different periods of time. Key support and resistance levels are indicated by the peaks and troughs. If you would like to receive a primer on using Volume Profile, please click here

