

Trying to make your way in this very tough market is nearly impossible without the right guide. Imagine trying to find a new destination without a road map (or gps or siri). You’ll find yourself getting lost, asking for directions and ‘hoping’ you get where you’re going before too long. It’s the same with trading markets and investing. If you are not armed with the right tools then you’re simply wandering lost. In all of my years in trading I have tried many different styles and approaches, but there is one system that stands out, head and shoulders above the rest.
The Chaikin Analytics platform is the one that could raise your game to another level. Below I have shown only a few of the benefits, but on June 25 we will all be joined in the webinar by the legendary stock trader, analyst and researcher Marc Chaikin, creator of the tools (oscillator, money flow and volume accumulator) that many of us use on a regular basis. Marc will also share some new ideas that will help us all reach that next level. More on that later, but for now let’s talk briefly about the analytics.
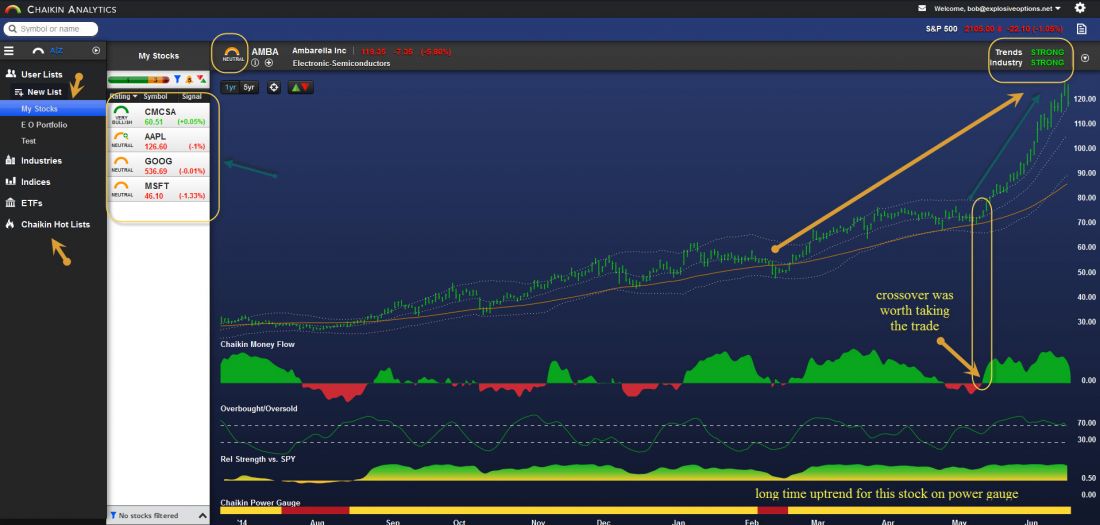
We can filter stocks as we choose with the analytics, and create custom lists. The top pain tells us a great deal of information without having to spend too much time figuring out the chart (click the chart to the right to open it up). For instance, the chart of recent high flyer Ambarella (Nasdaq: AMBA) shows a stock in a strong trend with a strong industry, but just backed off to being neutral. The indicators on the bottom have started to fall back (money flow, overbought/oversold) but we will see if they change. Of note, the money flow went green just as the stock was ready to surge in May.
Today’s blog is not just an endorsement of the superior analytics of this platform but a great place for anyone to start learning about technicals, patterns, trends and fundamentals. As we see below in the screenshot there are many strong features. On the surface the colorization and crispness of the design make for easy viewing. I look for platforms that are easy on the eyes and that show patterns that will pop out at me. Much of the mechanisms are designed to do the hard work for you. As with other programs, the analytics on this page can be changed to fit your personal preference. The indicators in the lower pane offer some of the most unique and congruous set of data for the technician. I like to see them all ‘line up’ with price and volume.
I need to make quick decisions as an options trader, I cannot spend too much time trying to figure out if a pattern is going to work. We can all find bullish and bearish arguments in a chart, and spending too much time leads to ‘analysis paralysis’. We need precise and definitive data to make quick decisions. This product delivers on all levels. For those who need more help and assistance, the ‘hot lists’ are a great tool to finding the best trends. In addition, there are videos and tutorials to help you get on your way.
One of my favorite elements is the power gauge report and chaikin insights, Marc’s view on markets and certain stocks that have his attention. In addition, the portfolio health check is a comprehensive look at the portfolio you create and how it is performing relative to the market, with power gauge alerts, earnings revisions, surprises and the chaikin power grid. All told, this analytics provide a wealth of data and information that will guide you along the way to making better trade decisions.
This was a just a teaser about the analytics platform. If you come to the free webinar on June 25 after the close you will hear Marc Chaikin LIVE and discuss more traits of Chaikin Analytics and how they can help you become better, along with the great chaikinpowertools.com. Sign up here and don’t miss this IMPORTANT webinar.

