The S&P 500 large cap index (SPX) ended last week at 2109.99 on Friday, up 17.16 points and a 0.8% gain for the week. It was a turnaround week: the SPX halted its decline and recovered all of the previous week’s loss.
The big issue for the week was the FOMC meeting mid-week and the various futures and options expirations. As usual, this was supposed to be the most important Fed meeting evah! As usual the Fed did nothing about interest rates. We’ve seen this movie too many times before.
This week
Last week was all Fed, this week – at least the first half – will be all Greece. The European creditors have scheduled an emergency meeting for today (Monday) and by the time our market opens the results will already be reflected in prices. Overnight there are rumors of a solution, and the market is bouncing.
We think it is a fake. The likely outcome is that both sides declare victory and the market gets a quick bounce on HFT manipulation. But nothing will be fixed. Nothing can be fixed. There is too much debt and not enough money. This is time for damage control; cover your assets and duck.
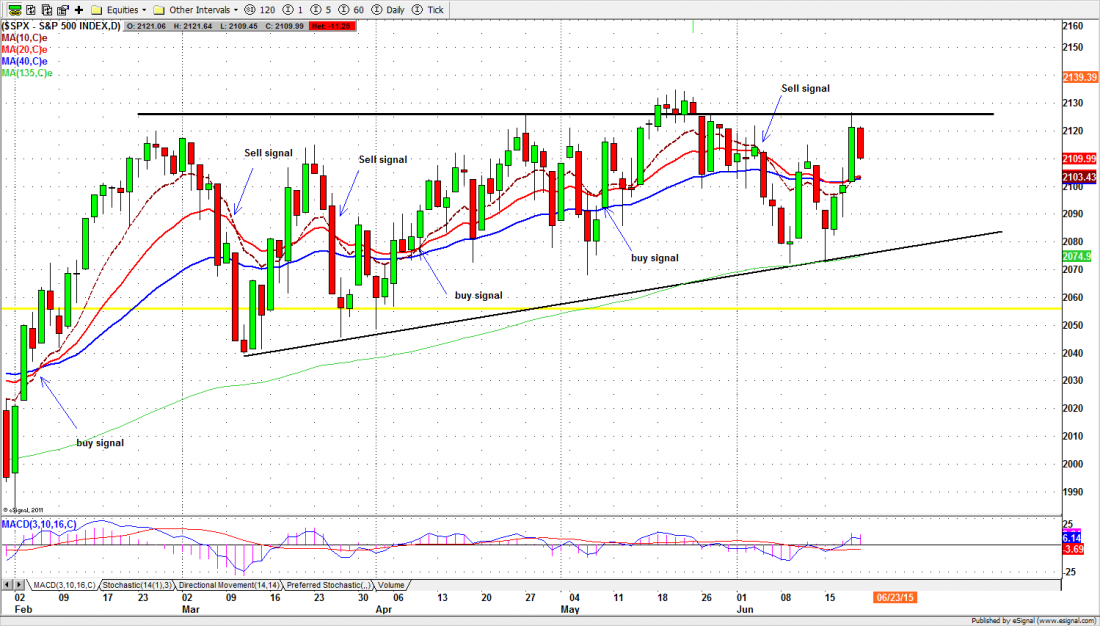
We have been moving sideways between the 2125 resistance and the rising 135-day moving average since October, with the exception of one brief break-out, which has since been reversed (see chart). That’s a long time to go nowhere and it looks to us like the market is probably in a topping process.
However the SPX could remain inside its 2125 to 2070 zone this week if the news from Europe is either less bad than expected, or is ignored by US markets.
ESU5
Today (Monday) 2092.50-2089 is a key zone for the S&P 500 mini-futures (ES). A break below it could lead ES down to 2082 or lower toward 2070-68. As soon as ES goes below 2087.50 it could force bullish pattern traders out of their positions and bring more sellers to join the bearish pattern.
Major support levels for Monday: 2070.50-68.50 , 2064-62.50, 2053.50-50.50;
major resistance levels: 2107-08.50, 2122-25, 2134-36.50 and none
To get more actionable analysis of US equity markets from Naturus.com follow this link
Chart: S&P500 daily chart, June 19, 2015