

After a steady two-month rally that started mid-March, US oil prices have remained trapped in a tight $5.00 range this month. The fourth consecutive week of declining bearish and bullish bets is also supporting the commodity to continue trading in the narrowest range in 19 months. A strong move however could be upon as we are getting past the expiry of the front-month July contract.
Gasoline prices are finally coming off an 8-month high, as concerns grow that gasoline may have been overproduced and may have stockpile concerns just like crude oil.
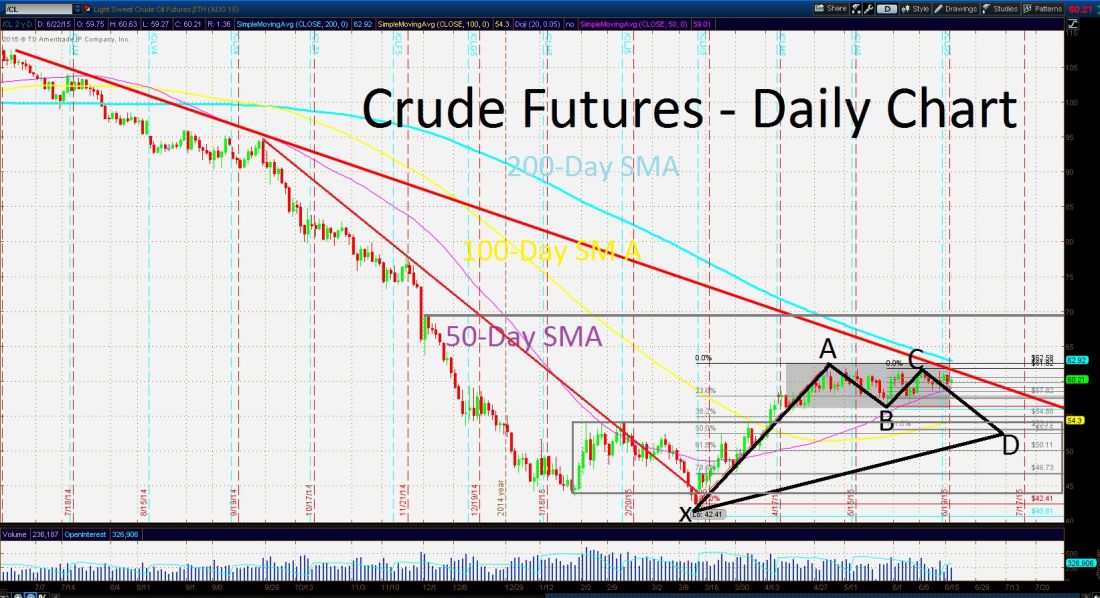
The US Crude Oil daily chart shows the current consolidation is slowly approaching the longer-term bearish trendline that began around last summer’s high of $107.50. A return of the strong downtrend could be upon us if price is able to finally break below the heavily tested 50– day SMA. Another catalyst for weaker oil prices could be if we see the U.S. dollar selloff during the next two trading sessions.
The bullish rebound from the $42.17 low to $62.58 could be providing us the first leg of a bullish Gartley pattern. If we see our noted resistance level respected and prices slide towards $52.50, we could see this bullish pattern provide a significant rally.
If we do see a significant advance, major resistance will come from the $67.50 level.
The trade: Sell oil at $60.50, with a stop loss at $61.50 and take profit at $57.50. The risk/reward ratio is 1:3
= = =
Edward J. Moya
Senior Market Strategist
WorldWideMarkets Online Trading

