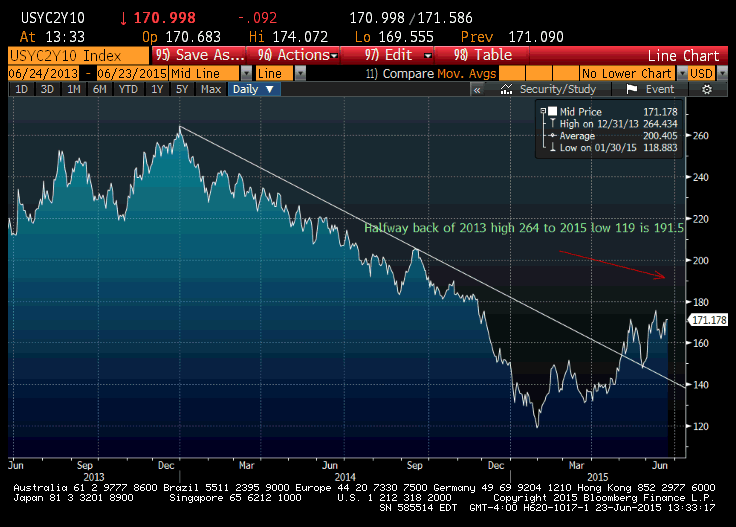
The US yield curve has been steepening throughout 2015, shown below as the rise in the 2/10 treasury spread. In this article, I am not going to be balanced, I’m just going to describe what I see, which should result in a continuation of the move towards steepening.
The dynamics in yield curve trades are many, but simplistically, the long end of the curve generally reacts to stronger economic growth and increased inflation expectations, while shorter maturities are more dependent on the Fed and short term financing rates. The curve is steepening and will continue to do so as long as the Fed maintains its tepid posture towards rate hikes. At last week’s FOMC, the Fed trimmed both its 2015 growth forecast (by necessity after the final results of Q1 came in), and also lowered the dot projections for end of year Fed Fund target rates. Neither event was much of a surprise. However, after the Fed meeting the market marked down the odds of a September FOMC rate hike from around 60-65% to just 50/50. On June 4 the IMF cut US growth forecasts and implored the Fed not to hike in 2015. Now the market is barely pricing one hike in for this year. In 2016, there will be the additional factor of the election, which might make it politically difficult for the Fed to begin raising rates.
What factors cause the curve to ebb and flow on its way higher? First there’s Greece. As the continued discussions lurch toward finding a way to keep Greece in the euro, the currency may tend to weaken as other peripheral countries also have the incentive to water down economic reforms. The dollar also will tend to strengthen against other currencies, notably emerging markets, as a safe haven. The Fed sees the stronger dollar as a restraining economic influence, and doesn’t want to be the catalyst for an EM crisis like the one in 1998.
So the tightening rhetoric is toned down. At the same time, recent data has shown domestic strength, though not uniformly so. As of June 23, the Atlanta Fed GDP Now estimate climbed to 2.0 for Q2. From the Atlanta site: “Following yesterday morning’s existing-home sales report from the National Association of Realtors and this morning’s reports on sales and prices of new single-family homes from the U.S. Census Bureau, the forecast for second-quarter real residential investment growth increased from 7.0 percent to 10.0 percent.”
Recall that in Q1 the Atlanta Fed got it right, steadily lowering its GDP estimate as the quarter progressed. It’s the exact opposite in Q2, the estimate has been grinding ever higher. I would note another, perhaps underappreciated factor, with regard to US monetary policy. Peer to peer lending has come from out of nowhere, allowing consumers and small business to bypass traditional banking channels and secure loans much more quickly and easily. In support of this argument, note the market cap of Lending Club, which went public in 2014 around $1 billion, now has a market cap of over $6 billion. Both revolving credit (credit cards) and wages have started to perk up. These factors tend to be bearish for longer maturities, even if there are periodic bouts of safe haven buying.
Put these factors together and watch 2/10 treasury spread move higher. Target the 50% retracement at 191.5.


