

The Nasdaq has been perky the last few days and only reluctantly agreed to start the expected (and required) gap-fill process late Wednesday morning (red dotted lines on the chart). I typically look for market reversals on Wednesdays; it’s not a hard and fast rule, but I’ve seen it often enough over the last 15 years to keep half an eye on it.
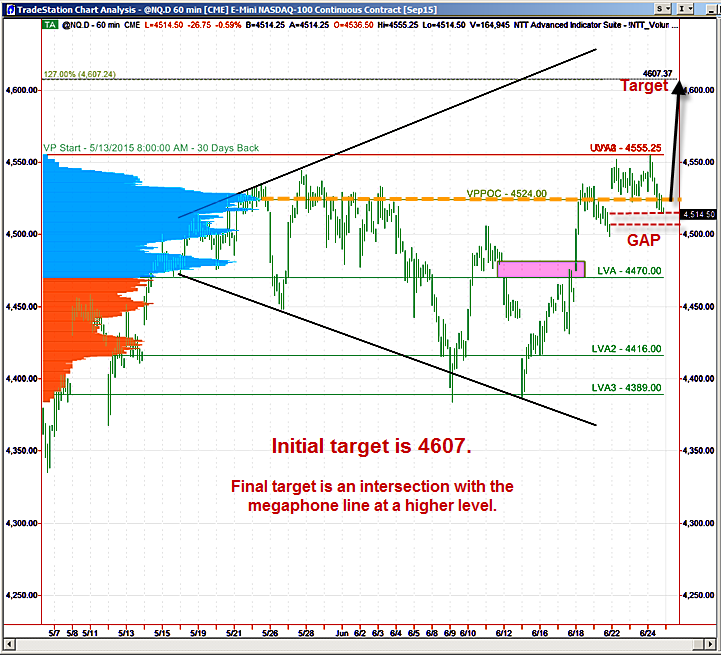
As you can see from the chart, the Volume Profile Point of Control (VPPOC) is quite pronounced at 4524. This shelf-like level should act as a stabilizing price magnet after the rest of the gap is filled. A sudden run down to the low volume node around 4488-4492 might represent an attractive buying spot.
The gap business is a short-term housekeeping task; the initial upside target is still the 127% Fib extension at 4607. If the bigger picture megaphone pattern illustrated on the chart completes, then we will get to enjoy a July rally.
A Note on Volume Profile
The histogram on the left side of the chart shows the volume distribution in the Nasdaq futures for different periods of time. Key support and resistance levels are indicated by the peaks and troughs. If you would like to receive a primer on using Volume Profile, please click here

