

The Nasdaq reluctantly began the gap-fill process late Wednesday morning and headed for the red dotted lines on the chart. The gap fill was technically completed by the close on Thursday. This isn’t a difficult prediction to make, as the market has been in “gap-hunt mode” for more than a month. These periods arise when there is a sufficient number of bears to create multi-day down moves.
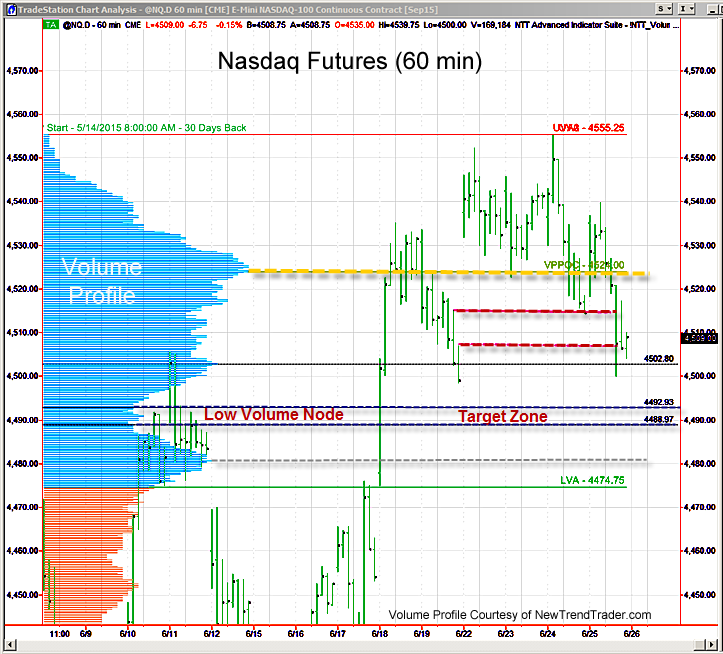
The gold line on the chart at 4524 is the Volume Profile Point of Control (VPPOC) and it is quite well defined. This will be the target for any bounce from lower levels. The Low Volume Node (LVN) between 4488 and 4492 is my ‘stealth’ target. Low Volume Nodes tend to be invisible to most traders. Traders tend to under-estimate their significance and then may find themselves quite surprised by the sudden bounce off these mystery levels.
Grexit is certainly a potential trigger for a deeper sell off. If that does happen, I believe the dip will be short-lived. My initial upside target is still the 127% Fib extension at 4607.
A Note on Volume Profile
The histogram on the left side of the chart shows the volume distribution in the Nasdaq futures for different periods of time. Key support and resistance levels are indicated by the peaks and troughs. If you would like to receive a primer on using Volume Profile, please click here

