

After three straight days of gains in the stock indices, the buyers that stepped up last week to buy in the long-standing zone of critical support are being rewarded.
This time around it was no great secret where support was located but this zone of support was established quite some time ago, like 6-7 months ago in fact. The lows of March and April were the first tests to this zone of support and it held each time. Now again, after repeated tests last week, it has held once more.
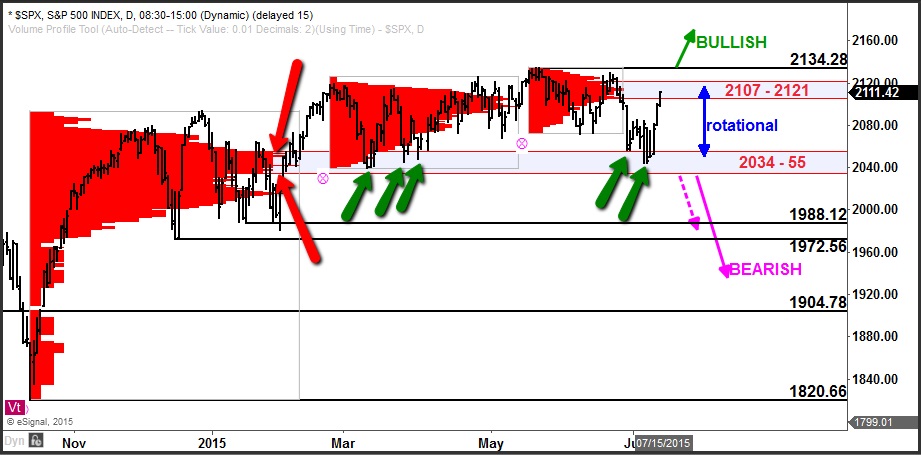
As you can see on this daily chart of the S&P 500 index, the 2034 – 55 zone was established as support by the volume profile that developed over November 2014 through February 2015. The high-volume area of this volume profile has marked support ever since. Each time it has been tested, it has attracted professional buyers and marked a near-term low in the market.
This zone remains the primary big-picture and critical zone of support in the S&P 500 index.
There is no technical analysis tool or method for finding support and resistance that is superior to volume-at-price information. If you’d like to see more about how to use volume profile analysis in your trading, visit http://www.volumeatprice.com

