

Our original price target for summer crude oil was $70. But the playing field in crude has changed. As such, we are not only adjusting that target, but feel the better opportunity for investors may be on the other side of the market.
A three pronged fork of global events has disrupted the “normal” supply/demand cycle in crude oil this summer. Fundamentals don’t change this rapidly often in commodities. When they do, a successful option seller must be prepared to take advantage of the situation.
This piece will show you how to potentially profit from the new playing field in crude oil.
Why Have Crude Prices Tumbled?
Primarily because of the “Three Pronged Fork” of global events we mentioned earlier. They are:
- Greek Crisis – “Grexit” as it has become known in the media, seems to have been avoided for the time being as a tentative deal was announced between the EU and Greece for another “rescue.” While the markets took a huge sigh of relief this week, this doesn’t automatically make everything sugar and spice again. While the deal has been agreed to on paper, the actual implementation could be “messy” as Mohammed El Arian put it this morning. In addition, Greece could be in a position to need additional funds as early as next year – potentially prompting another round of this ongoing drama.
Why it’s bearish for Oil: While a Greek exit from the Euro seems to be off the table for now, it’s continued inclusion doesn’t make the Euro a stronger currency. In addition, a divergence in monetary policy between the US and Europe could further weaken the currency.
Our synopsis: Despite avoidance of a “Grexit”, the path of least resistance for the Euro still seems lower while the dollar path still seems higher. This is bearish for oil prices.
- Potential for a Nuclear Deal with Iran: In another situation that appeared unlikely a few months ago, a US nuclear deal with Iran now seems like it’s in the home stretch and will get done in the coming days. A deal would almost certainly lift sanctions on Iran. Should sanctions be lifted, Iran is expected to double its current oil exports to 2.3 million barrels per day.
Our synopsis: With the current administration seemingly hell-bent on a deal with Iran, expect it to get done. An additional 1 to 1.2 million barrels of oil a day flooding the market would be a bearish influence on price for both the short and longer term.
- The China Syndrome: Stock Market Crash and Lower Chinese Demand. The Shanghai composite falling nearly 30% in three weeks has been headline news as of late. While the stock market represents only 40% of the overall Chinese economy, it is made up of nearly 90% individual investors – many of which bought in close to the top. While these may not have an immediate effect on Chinese oil demand, its longer term effects could be significant. This in an economy that was already seeing slowing growth. For the first 5 months of 2015, Chinese oil imports were down 5% over last year. May imports were down 10% over the same time last year.
Our synopsis: Of the three, slowing Chinese demand could have the biggest impact on longer term oil prices. While many feel the breathtaking drop in Chinese stocks is uncorrelated to most global indices, it is reminiscent of the Nasdaq’s drop in 2000 and cannot be dismissed as irrelevant. Market instability and its unknown effect on the world #2 (already slowing) economy has unnerved many equity investors. (This is an important story and presents many unique opportunities for commodity option sellers. A full examination of the situation in China will appear in the August issue of your Option Seller Newsletter.)
The Other Fundamental in Crude Oil
While crude stock draws predictably fell for 12 of the last 14 weeks, the last two weeks have seen unexpected supply builds in stocks. This at time when summer gasoline demand is typically continuing to eat away at stockpiles. Why the builds?
It’s not demand. Demand has been firm in 2015 as US drivers are taking advantage of lower gas prices to spur one of the most active travel seasons in years.
The fact is that the expected slowdown in US production never really materialized in full. While rig counts indeed dropped precipitously, frackers merely concentrated on more productive wells, ramping them up to full capacity.
The drop in rig counts, however, has now not only subsided, but reversed. In the first week of July, the US rig count actually grew (albeit modestly) with net rig count growing by 3. But more significant, rigs focusing primarily on drilling for oil grew by 12, representing a 2% jump in total count. This trend continued last week with net rig count climbing another 5 to 645 rigs.
Why is this happening? The belief that US operators couldn’t turn a profit with prices under $60 turned out to be somewhat unfounded. Rig counts ticking up seems to suggest US producers are growing more comfortable with lower prices and willing to go back “online” at current levels.
While $50, $45 or $40 oil could change that, an emerging view is that US frackers have “turned the corner” in terms of rig count declines.
————————————————————————————————————
What about the Seasonal?
As you may have read in previous crude oil updates, crude oil demand typically remains strong through mid-summer as gasoline demand at the retail level keeps refineries running at high operating rates, often drawing down crude oil inventories. This has historically been supportive to price through mid-summer.
As demand levels off and refineries begin to throttle down to prepare for heating oil season, crude inventories often begin to build again. This is known as “shoulder” season and it can be a bearish influence on prices. (See seasonal chart below)
December Crude Oil Seasonal
SEASONAL CHART HERE
Caption: Crude oil prices can tend to weaken into August and September as “shoulder” season arrives.
While lower crude inventories have tended to support prices into late summer, the latest round of international news and unexpected strong production from US frackers is outweighing this tendency in 2015. For this reason, we will be looking to begin positioning early for shoulder season this year with the expectation that the top in crude prices has already occurred.
——————————————————————————————————–
Outlook
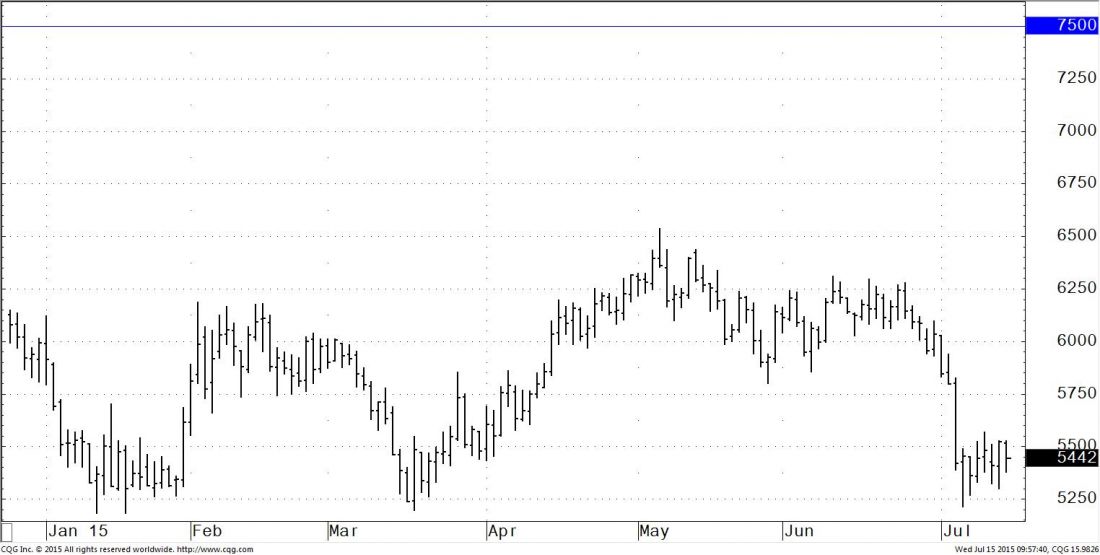
Crude prices have already dropped by 16% in the last 3 ½ weeks. The question is, at what point are the items listed above priced into the market? As option sellers, we’re not in the business of predicting the future. Predicting where price will go would mean predicting the outcome of several uncertain events.
Our best guess is that the events above coupled with the advent of “shoulder season’ will result in oil prices gravitating between $45 and $55 per barrel in the coming weeks. The risk of a further breakout appears greatest on the downside while we would think it surprising for crude to get back to recent highs of $65 by years end.
Strategy
That being said, we’re not predicting where prices will go. Instead, only selecting levels where the market is unlikely to go over the next 90-150 days. To that end, selling calls with strikes above $70 would appear to be a high probability trade for investors right now.
December Crude Oil
Selling the December Crude $75 call.
We suggest the December options with strikes ranging from $70 to $75 and premiums from $500 to $1,000 (which are still available, even after last week’s price decline.) A bump over the next 2 weeks in oil prices would be an opportunity to sell at higher premium or simply sell higher strikes. Conservative option sellers can wait for a bounce in prices over the next 7-10 days to position.
We’ll be seeking positioning opportunities for our clients this week.
If you are a high net worth investor interested in selling options in crude oil and other commodities, you may qualify for a managed option selling portfolio with OptionSellers.com. To learn more, request your Free Investor Discovery Kit at www.OptionSellers.com/Discovery.
James Cordier is the author of McGraw-Hills The Complete Guide to Option Selling, 1st, 2nd and 3rd Editions. He is also founder and president of OptionSellers.com, an investment firm specializing in writing commodities options for high net-worth investors. James’ market comments are published by several international financial publications and news services including The Wall Street Journal, Reuters World News, Forbes, Bloomberg Television, Fox News and CNBC. Mr. Cordier’s book, The Complete Guide to Option Selling 3rd Edition (McGraw-Hill 2014) is available at bookstores and online retailers now.
www.OptionSellers.com
- Price Chart Courtesy of CQG, Inc.
- Fundamental Charts courtesy of The Hightower Report
- Seasonal Chart courtesy of Moore Research, Inc
***The information in this article has been carefully compiled from sources believed to be reliable, but it’s accuracy is not guaranteed. Use it at your own risk. There is risk of loss in all trading. Past performance is not necessarily indicative of future results. Traders should read The Option Disclosure Statement before trading options and should understand the risks in option trading, including the fact that any time an option is sold, there is an unlimited risk of loss, and when an option is purchased, the entire premium is at risk. In addition, any time an option is purchased or sold, transaction costs including brokerage and exchange fees are at risk. No representation is made that any account is likely to achieve profits or losses similar to those shown, or in any amount. An account may experience different results depending on factors such as timing of trades and account size. Before trading, one should be aware that with the potential for profits, there is also potential for losses, which may be very large. All opinions expressed are current opinions and are subject to change without notice.

