
I’ve been discussing news-driven gaps for several months now. Last week was irrationally exuberant in the gap department (see magenta boxes on the chart).
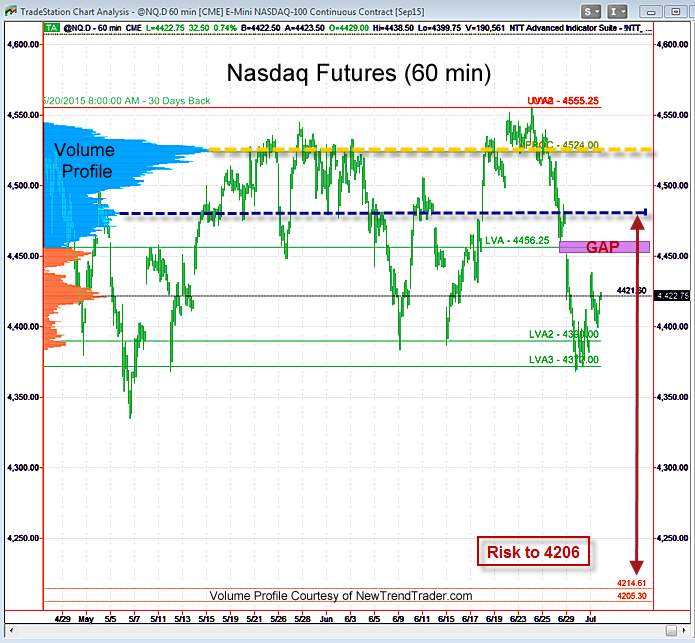
Good enough news from Greece and stocks like Google ignited a 7.3% rally in the NQ from trough to peak. The Volume Profile chart shows the bigger picture megaphone that I discussed on 6/23 and 6/26, which is now complete. This is actually a bearish development.
I say that because there is very little volume supporting this over-extended market. And a completed pattern such as this begs to mean revert to the 4492 area, at the very least.
This is a good time to book some profits.
A Note on Volume Profile
The histogram on the left side of the chart shows the volume distribution in the Nasdaq futures for different periods of time. Key support and resistance levels are indicated by the peaks and troughs. If you would like to receive a primer on using Volume Profile, please click here.

