

The grain markets had been in a steady slide to value prices as more global acreage comes online and modern farming practices continue to increase yields and productivity. The benign spring across much of the grain belt allowed corn in early and good soil moisture alleviated some of the national water rights issues. Early acreage numbers were large and forecasts were good….until recently.
Today, we’ll focus on the corn market. Thanks to its relatively small contract size and consistent response to fundamental, seasonal and technical analysis, it should be a favorite of new commodity traders. Meanwhile, the enormous size of the market helps ensure liquidity while also allowing us to trace the moves of its largest traders.
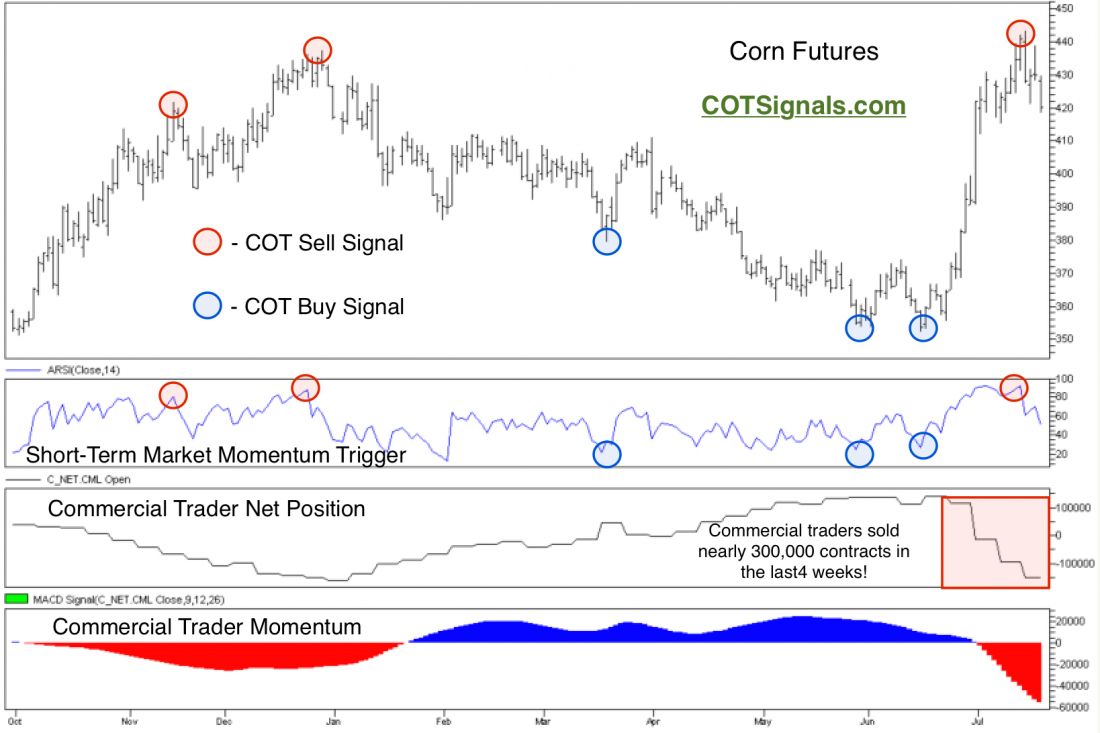
Moving right to the meat of it. Between June 15th and July 15th the September corn futures shown on the chart below have rallied more than $.90 per bushel, nearly 26%. The rally was based on weather concerns as storms ran through the nation. The recent rally appears to have overshot the commercial producers’ value targets as their forward selling accelerated rapidly once corn climbed above $3.80 per bushel. The fear premium in the grain markets is on the high side. Commercial producers have sold nearly 300,000 contracts based on the crops they already have in the ground. They’re THRILLED to be selling this year’s crop above $4.20 per bushel.
Seasonally, we’ve had almost a double spring. Early to get planted followed by a second cool, late spring. The recent storms and predicted heat haven’t done as much damage as forecasted to the corn market. Furthermore, the heat wave will help alleviate the remaining ponding issues. This sets the market up for a late, but typical summer, sell off into the late august heat.
Finally, the full technical setup shows a rounding top being sold heavily by commercial traders. Friday’s downward action was enough to cause our short-term momentum indicator to fall from overbought levels and trigger a COT Sell Signal. The signal is protected by the recent swing high at $4.4325. Technically, the market should easily test the $3.87 area, which is both the .618 Fibonacci retracement level as well as solid chart support. However, if we consider this to be a weather event whose eventuality will price in a fairly healthy crop, the market could easily test the $3.60 – $3.70 area.
Learn more about Waldock’s work here.

