

Indicators for a Stock Market Correction or Bear Market
List of Why Leading Indicators Are Needed for Selling Short
The Stock Market Downtrend has changed dramatically in terms of how price moves in the past decade. This is due to numerous changes to the Market Structure for the sell side. There are now more Market Participant Groups, venues, speeds of execution, and order types for the giant Institutions and Professionals which have altered how price behaves in a Downtrend. There are also rules pertaining to Selling Short, Decimals, and Stock Derivatives affecting the Downtrend as well as new Indicators for a Stock Market Correction or Bear Market for Technical Traders.
For this article, a Market Correction is any Downtrend that lasts less than one year. It can be either a Short Term Correction lasting less than 4 months, or an Intermediate Term Correction lasting usually 6-9 months. Although the Retail Media prefers to call every Downtrend a “Bear Market or Bearish” this is an inappropriate term for these types of Stock Market Corrections.
Retracements are brief episodes of profit taking, resulting in a minimal move down within the normal range of the upside price action.
It is also imperative that Technical Traders understand that a Trading Range Market Condition in which many stocks and the major Indexes move in a wide Sideways Trend, is also a Market Correction. The Stock Market of 2015 has been in a Trading Range Market Condition for the major Indexes and their components, along with several important Industries.
In order to trade the Downtrend successfully analysis of the Trend, Price Action, and Trendline Patterns must be accurate. Indicators that work ideally for the Uptrend are not ideal for the Downtrend, because for the Downtrend they must be leading indicators.
Here is a list of reasons whyleading Indicators for a Stock Market Correction or Bear Market are needed:
- The Downtrend moves more steeply and faster than the uptrend in the early stages of the Market Correction or Bear Market.
- High Frequency Trading firms tend to move price in wide gaps in the beginning of a Downtrend, as well as at the middle and near the end just before a bottom commences.
- Only 3 of the 9 Market Participant Groups sell short. This means there are 6 groups who are not actively trading a Downtrend with the goal of making profits by selling short for the short term.
- The Upside is Fundamentally driven price action, while the Downtrend is Technically driven price action.
- On the Uptrend, Volume and Quantity of buyers drive price upward. To sustain the Uptrend momentum more and more Volume is required, while on the downtrend side price can and does fall and collapse on much lower Volume.
Technical Traders need to have specifically designed Chart Layouts or Templates, Sell Short Scans, Sorts, and leading Indicators for Stock Market Corrections and Bear Markets. Indicators for Selling Short in particular require special tweaking to make them reliable, non-reactive to the speed of the downside, and accurate for the Downtrend action.
Taking the time to set up charts and indicators for the Downtrend before a Market Correction or Bear Market begins is best. This gives Technical Traders the ability to quickly adjust and adapt to the suddenness of the Downtrend, which many times begins before they realize it has started.
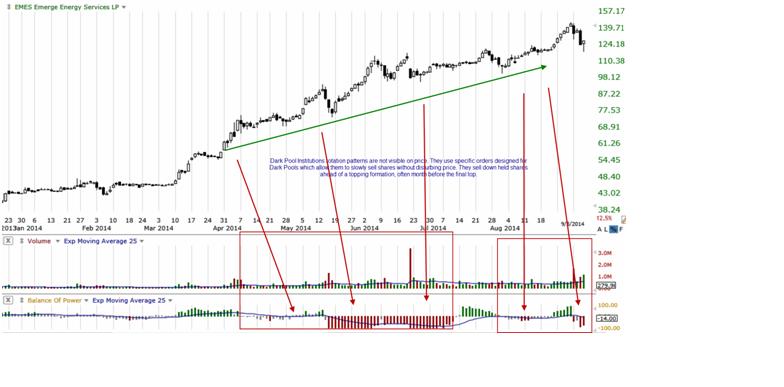
A critically important indicator for Selling Short is a large lot rotation Indicator which can reveal the giant institutions that control trillions of dollars in assets, are slowly and quietly lowering their percentage of held shares. These patterns are Quantity based analysis and rarely does the Quiet Rotation™ out of a stock alter the Trend, which is usually moving up as rotation is going on. Without a large lot rotation Indicator such as Balance of Power which is one of the best large lot versus small lot rotation indicators, Technical Traders will be unprepared for the sudden new Topping Formations such as the “Flat Top,” “Sheer Cliff Top,” and “Rounding Top” as well as many more. These new Topping Formations are often missed by Technical Traders, who have not yet learned how to identify with Indicators for Stock Market Corrections and Bear Markets that they are forming.
Example #1 below is the stock chart for Emerge Energy Services LP (NYSE: EMES). The indicator Balance of Power in the bottom chart window provides an early warning for risk of a Topping Formation prior to it occurring as indicated by the red arrows.
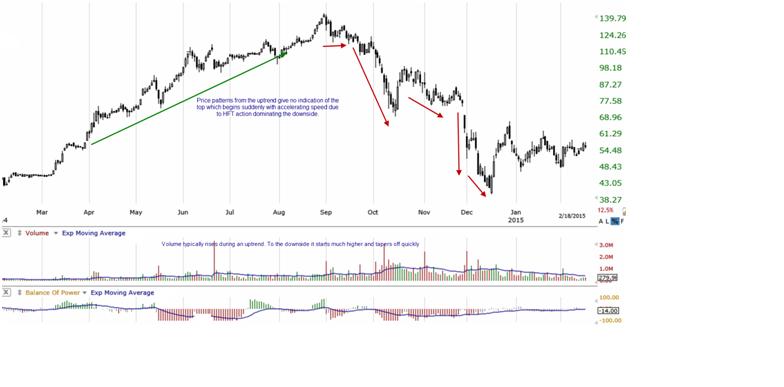
Example #2 below is the same stock chart showing the Top Formation, and the acceleration of the Downtrend. Note that Volume declines on a Downtrend, while it increases on an Uptrend. Volume is an essential indicator that must be modified slightly for the Downtrend and Selling Short, particularly for Swing and Momentum Sell Short Trading. Period settings and subordinate indicators must be tightened, based on the Trading Style and Parameters each Technical Trader uses.
Volume Oscillators and Flow of Funds indicators are also important during a Topping Formation. This is because these indicator patterns tend to lead price, and expose weakness in the Uptrend which is rarely shown in price action.
Example #3 below is the same stock chart again, but this time there is a Volume Oscillator called Time Segmented Volume in the middle chart window, and a Flow Of Funds indicator called Moneystream in the bottom chart window.
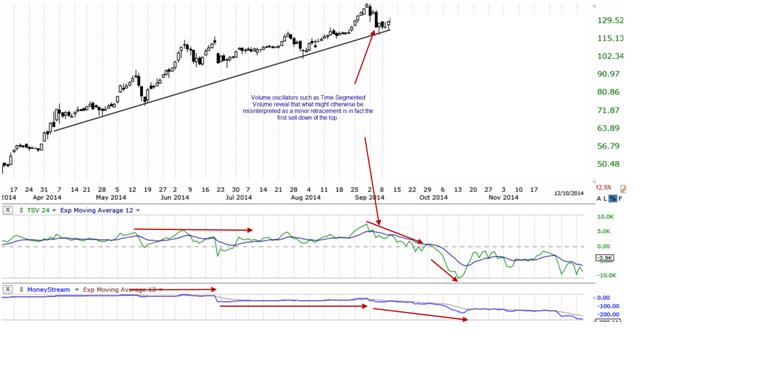
The red arrows in the two indicator chart windows, show how these two types of indicators lead price prior to the start of the Top Formation sell down.
Summary
Technical Traders need to set up Indicators for Stock Market Corrections and Bear Markets ahead of time, in addition to a set for the Uptrend. Each set of indicators will be unique to that particular Market Trend. Indicators for the Downtrend require tighter Period Settings, Exponential Moving Averages, and sensitive Sub-Ordinate Indicators to aid in keeping the Indicators leading price but not so tight as to create a reactive pattern.
Since the Dark Pools are able to hide their activity within price and seldom alter trend or price direction, Technical Traders need to employ leading indicators based on Quantity, Large Lot versus Small Lot, and Flow of Funds as well as other Volume and Quantity based indicators. Relying on Price and Time indicators will not provide the necessary analysis to be ahead of Topping action.
Trade Wisely,
Martha Stokes CMT
TechniTrader technical analysis using TC2000 charts, courtesy of Worden Bros. Inc.
Disclaimer: All statements are the opinions of TechniTrader, its instructors and/or employees, and are not to be construed as anything more than an opinion. TechniTrader is not a broker or an investment advisor; it is strictly an educational service. There is risk in trading financial assets and derivatives. Due diligence is required for any investment. It should not be assumed that the methods or techniques presented cannot result in losses. Examples presented are for educational purposes only.

