

Trend-following gets a lot of lip service, but there are as many ways to identify a trend as there are traders. What do you use? In this article I will review a less popular indicator that might be useful for serious trend followers.
When market movement is reported in the financial media price tends to have priority. But markets move up and down in both time and price. Indeed, it’s often the fastest moves that lead to the most volatile counter-reactions, which is what we are seeing on a daily basis in the major indices over the last month.
The Aroon indicator differs from other price momentum oscillators in that it references both time and price. The name Aroon is a Sanskrit word that means “dawn’s early light.” The intent behind the indicator, according to its creator Tushar Chande, is to signal trend changes as early as possible.
The indicator consist of two lines, “Aroon Up” and “Aroon Down.” The “Aroon Up” line tracks the upward strength in a market whereas “Aroon Down” shows downward momentum.
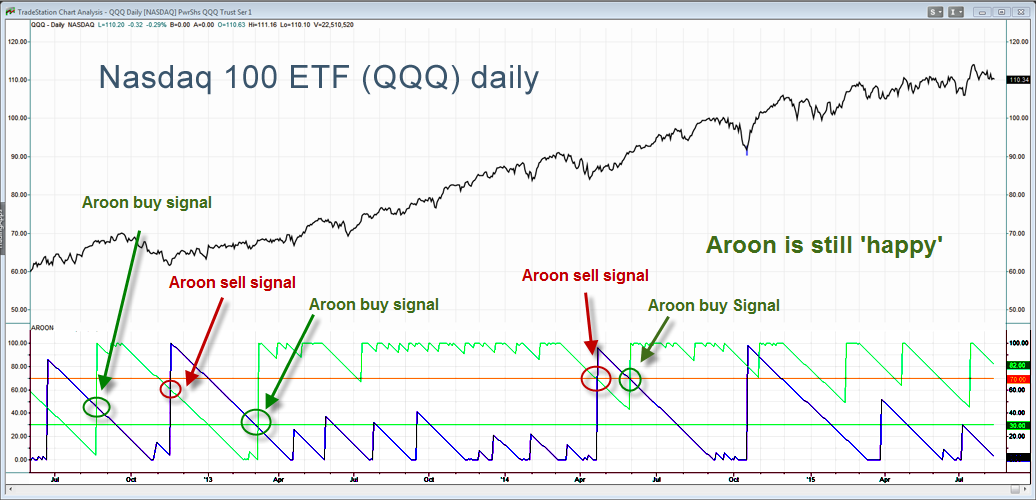
The indicator is typically used as a trend filter, such that longs would be taken when Aroon Up (green) is above Aroon Down (purple), and shorts would be taken when the inverse is true. The standard length for the Aroon Up and Aroon Down is 25 periods, but in the chart of the QQQ accompanying this article the Aroon length is set to 100 to capture the long-term trend. The last sell signal on the 100-day Aroon was in late April 2014, but it didn’t last long.
The Aroon has advantages over standard moving averages. If you were to plot a 100-day simple moving average on this chart you would have had several instances where price crossed below it, including last October and early July of this year. Those dips proved to be buyable; no surprise to Aroon.
The Aroon is not the most popular trend indicator, but it is worth checking out. And at the moment, the Aroon is singing that old Bobby McFerrin refrain… “Don’t worry, be happy.” How refreshing!
= = =
Kenneth Reid, Ph.D.

