
The Canadian Dollar has been mired by the commodity slump through the last couple of years. This mostly due to their economic reliance on commodity exports like oil, cattle and grains. The Canadian Dollar has lost 30% in the last three years and 10.5% since May. While the market mechanisms that establish new fundamental prices and governmental budgets take time work through, there is certainly a trading opportunity be had in short order as this market tests $.75 to the US Dollar which has been a key price over the last decade.
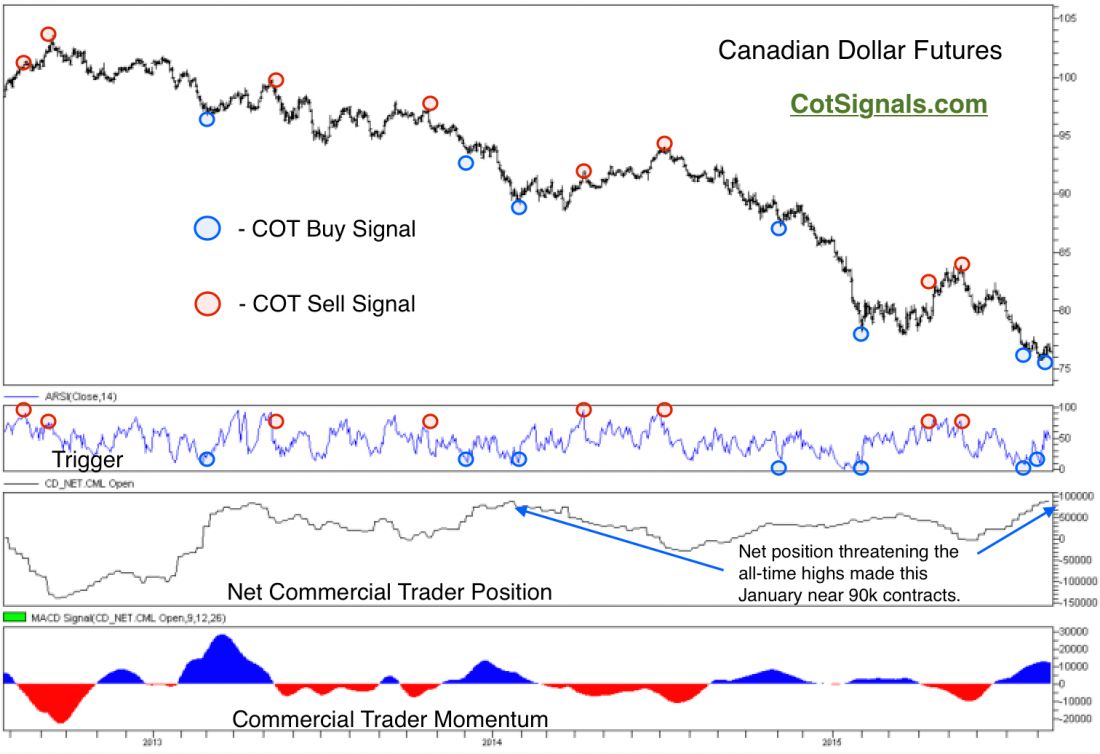
The Canadian Dollar traded down to $.73 in June of 2004. That was the last time it has been this week against the Greenback. We view this level as primary support and will cast our lot with the commercial traders who are clearly expecting a mean reversion rally. The commercial traders set a new bullish all-time record position in the Canadian Dollar in January of last year near 90,000 contracts. There have only been four periods in the commercial trader history of the Canadian Dollar that saw their net position grow beyond 85,000. We are currently experiencing one of them, as you can see on the chart below.
There are three year’s worth of Commitment of Traders trading signals on the Canadian Dollar chart. This provides a great example of commercial trader behavior in trending markets. Commercial traders are negative feedback traders. This is a mean reversion strategy that forces them to buy the market below their value area and sell the market above their value area. The farther the market moves beyond or, below their value area, the more they proportionally buy and sell. This is how they end up with their largest positions at the market’s biggest turns. Finally, we track both their momentum and their total position. You can see that even though their net position remained positive during most of this downtrend, the periods of negative momentum allowed us to take trades on the short side of the market as well.
This brings us to the current setup. Commercial traders have been net buyers for 12 straight weeks. The recent low is $.7566. The current chart formation suggests a weak bear flag from last week’s trading. This would imply a fall to new lows and a test of $.75. We are looking for a reversal higher from this level. We believe the market to be fully supported at this level and that the recent decline has been overdone. Once the swing low is complete, we’ll use that chart point as a protactive stop level.

