

Gold broke out of a small pennant formation on the daily chart last week and gained $18.80/oz. to close at $1,112.90. On the weekly chart gold printed an engulfing bullish candlestick. The breakout above 1,100 is bullish but the real test will be a breakout above 1,140. For now, the daily Coppock Curve is rising and has a ways to go before it will signal a top in gold. Cyclespoint to an important low during July and a rally for all of August. Seasonally, August is very bullish for gold.
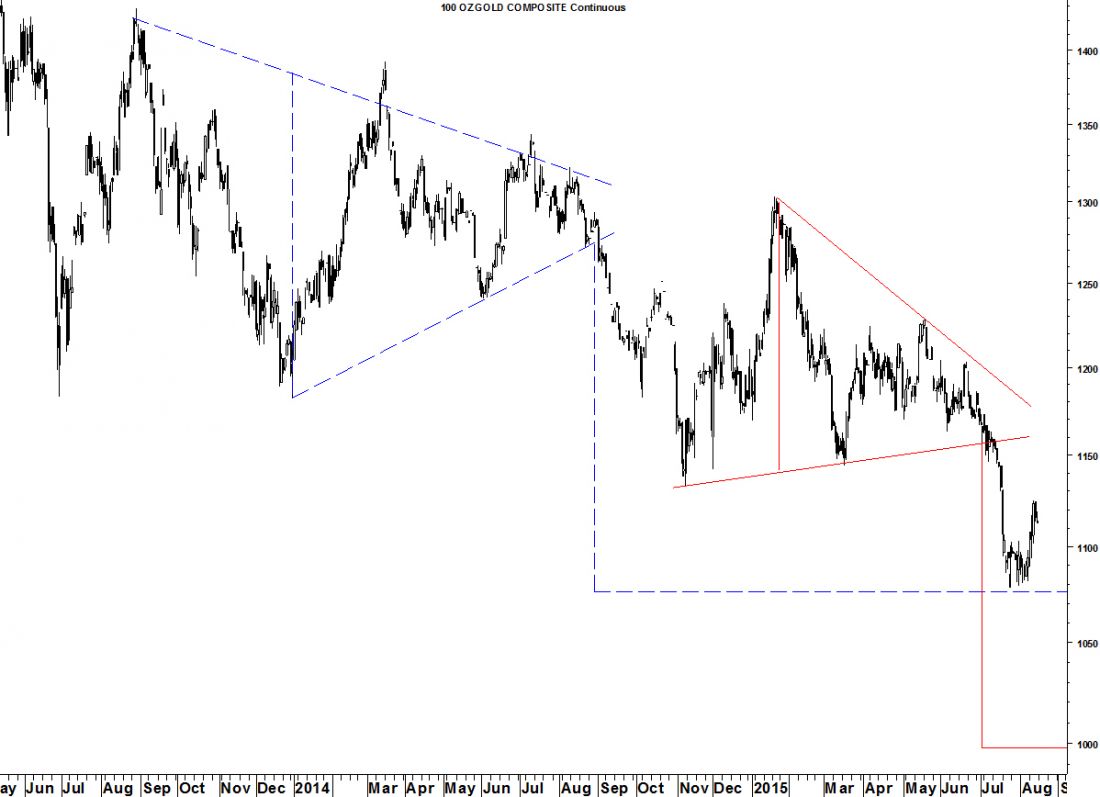
Don’t forget that gold moves inversely to the Dollar and I still expect one more rally to a new high by DXY. A triangle forecasts a minimum decline in gold to $1,000 and a 4 year cycle low is not due until the first half of 2016 keeping the long-term outlook bearish.
Get a Free copy of the Hybrid Lindsay year-to-date performance review at SeattleTA.

