The picture below is just one example, albeit a powerful one, that demonstrates the power of looking at volume-at-price information. It is one of those pictures that’s worth 1000 words.
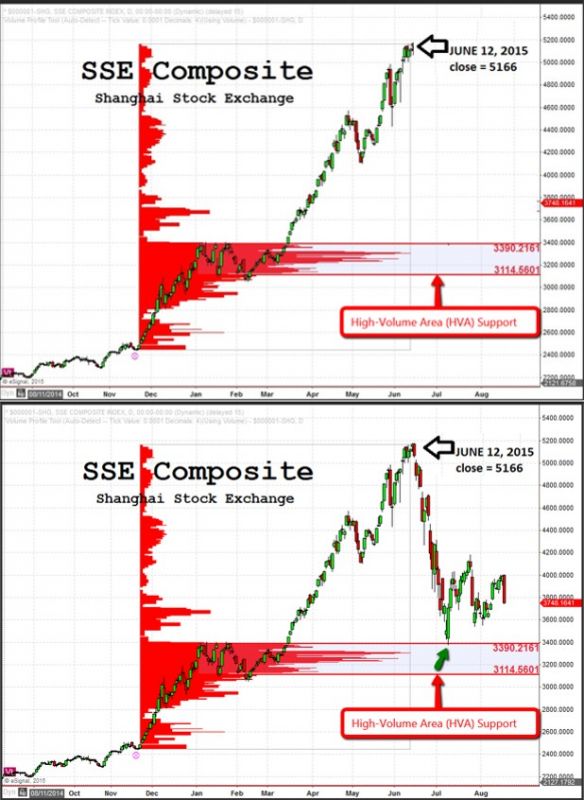
The Shanghai Stock Exchange went into free fall after making its June 12th high at 5166. It went on to lose over 34% in just a single month.
The steep decline turned on a dime and has been choppy since hitting its July low at just under 3400. What was the significance of the location of that low?
Looking at volume-at-price information as the SSE was making its 5166 high, it was easy to see the location of a pronounced high-volume area.
Using volume-at-price information to determine the location of HVA’s is the best method I’ve seen within the realm of technical analysis for finding support and resistance levels.
On June 12th, as the SSE Composite was putting in a closing high at 5166, the one thing you could say definitively from looking at the chart at that time was that there was a well-defined HVA at 3114 – 3390.
There was no way to know that the index was about to fall off a cliff and would test this HVA only a month later. However, when the SSE Composite touched to this HVA, there was an immediate and profound reaction.
The upper boundary of this area was clearly an area where professionals covered shorts and/or were prepared to become buyers and they did so in force.
Volume-at-price information gives insight into the chart and price action that other technical methods cannot. Professional money is aware of this information and their actions are evident as you look at charts like this one.
If you’d like to see more about how to use volume-at-price analysis in your trading, visit here.