This was not The Big Crash the shorts have been waiting six years for. But what happened to US equities yesterday and in the overnight market gave investors little taste of what a market death spiral would look like.
All three US major indices plummeted right out of the gate Thursday morning and never looked back. By the end of the day session the S&P500 breached the 200-day moving average which has been solid support since February and closed in the red for 2015, down 1.1% on the year.
THE S&P500 mini-futures, the ESU5, closed at 2025.50, down 47 points from the previous close. It dropped another 15 points in the overnight market.
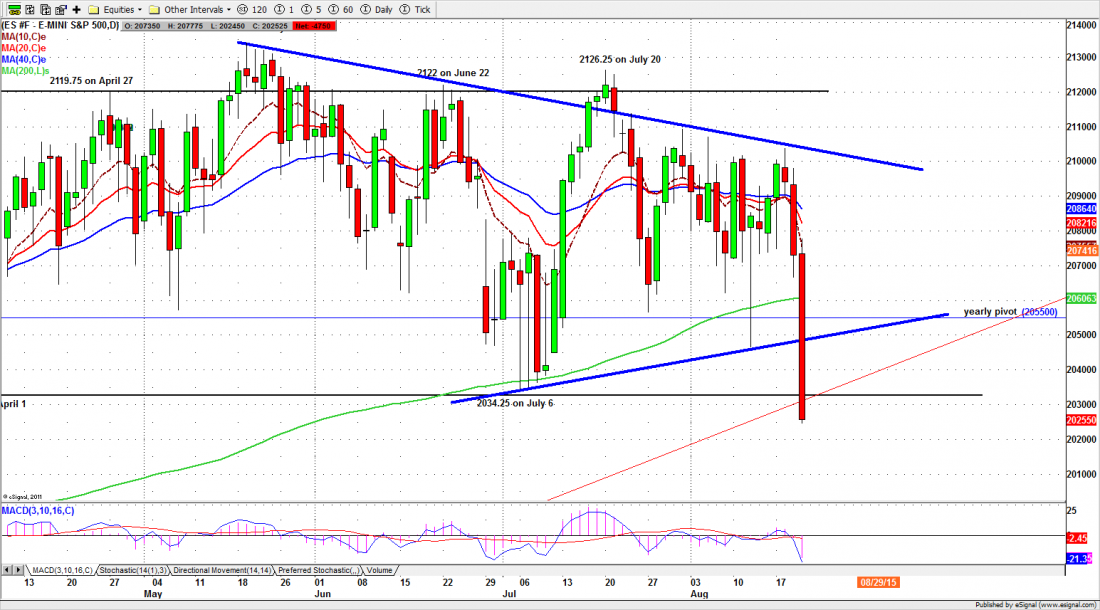
From a high of 2100 on Monday, last night the ESU5 was trading at 2010 when we stopped watching. The futures have now taken out several important support levels (see chart).
There was similar carnage in overseas markets, particularly China, where a horrible Purchasing Managers (PMI) report sent the Shanghai Composite below the 200-day moving average, the support line the Chinese government has been defending at all costs. (The China data started the overnight decline in US futures).
The likely next step is a little oversold bounce and some strenuous effort from the Plunge Protection Team. But all bets are off for a Fed rate hike in September.
Today
The 2055-65 area now becomes the first major resistance zone. This area used to help hold the ES up. Now it will prevent the price from popping. As long as this zone holds the futures down, any rally will meet sellers, and the short-term trend will be down.
Today we may see an oversold bounce, but this bounce shouldn’t last very long. Traders should focus on the resistance lines and use a “short-the-bounce” strategy. Yesterday’s breakdown points were 2045.25-2051.25 and 2057-2065. We will see sellers showing up at those levels today.
The major support levels for Friday: 2012-13.50, 2000-1998, 1975-80;
major resistance levels: 2045.25-2051.25-2057-2065-2083.25-2093.50
For more detailed market analysis from Naturus.com, free of charge, follow this link
Chart: S&P500 mini futures (ESU5) daily chart to Aug. 20, 2015