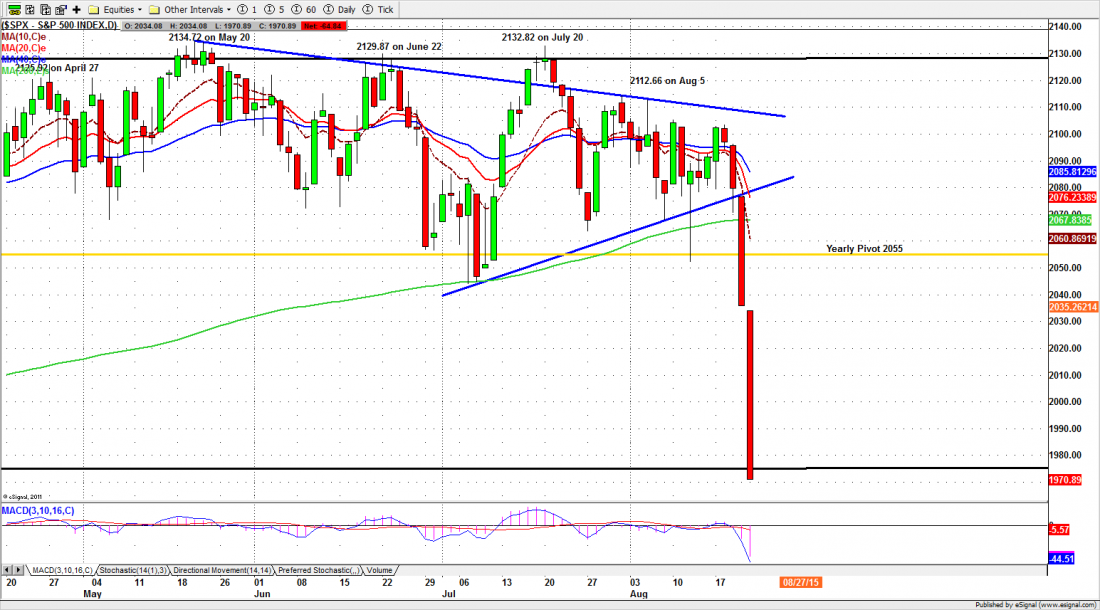
The S&P 500 cash index ($SPX) closed at 1970.89 last Friday, down 120.61 points for a 5.76% net weekly loss. That bland statement doesn’t begin to describe the blind panic traders felt last week as they watched US equities drop through the trapdoor the Bears have been warning about for years.
The SPX closed at a level last seen in mid-December, and is now firmly in the red for 2015. The Dow and NASDAQ had similar declines; it was the worst day for equities and equity indices since 2011.
The bloodbath may well continue this week. Overnight Sunday the S&P mini-futures were trading below 1915 at one point. The Plunge Protection Team must be at the beach.
Virtually all of the support areas that had been preventing the decline of the large-cap index were blown out, and will now become resistance areas holding down every bounce. There is no longer any real debate: the intermediate term correction has begun.
So what happens next?
External events – China, oil, currency devaluations, the cries for a new QE from the Fed – will all play an unpredictable role. But we have an initial target around 1944 for the first leg of this decline. After that we could see 1895-85, then the last of the initial targets should be near 1829-25.
Ultimately a 20% retracement from the high – not an unusual retracement – would bring the index to around 1650. A 38% retracement of the move from the March 2009 low at 666 to the top at 2134.72 would put the price around 1575-1585, close to the break-out point for the SPX.
Whether that would be allowed to happen in the final year of the presidential election cycle is a question we can’t answer, but it would be more likely in November 2015 than November 2016.
In order to reach those areas, the index has to hold the price under the 2055-28.50 zone, which is now an active resistance area.
One thing seems pretty clear: the high we made at 2134.72 in May will probably not be seen again this year, and maybe not next year either.
ESU5
There may be continuation selling in early trading today (Monday) especially if margin calls increase, but at some point the victorious shorts will want to take their profits and there will be a small bounce in the price. The ultra-short-term indicators are all oversold.
Don’t place much faith in any early bounce. This was a strong momentum break-out on heavy volume. It will go further.
There were several breakdown levels (now become resistance) around 1980-86 that may be tested today or later this week. 2022-2029 will be the major resistance area; as long as the price does not move past it, any bounce will be sold at the intraday resistance areas.
The major support levels for Monday: 1940-35, 1922-18.50, 1905-00, 1875-50.50;
major resistance levels: 2029-28.50, 2055-45
For more detailed market analysis from Naturus.com, free of charge, follow this link