I usually write a column on Volume Profile on Mondays, but this week I’d like to show a ‘normal-looking’ monthly chart of the S&P 500 with a projected year-end target.
Last week I pointed out that the Volume Profile Point of Control for the S&P futures (ES) is at 2092 and the strong volume spike at that level means there are now many trapped longs who are under increasing stress. Selling does beget more selling when traders use margin and I expect that will be a talking point this week and used to explain why there is no bounce.
Last Friday morning I noted that there is little volume support for the ES around 2000 and suggested 1941 as the next target. Overnight we took out that level, but we could bounce up to test it. That said, the next important Volume Profile support level is 1870, but I doubt we will stop there for very long.
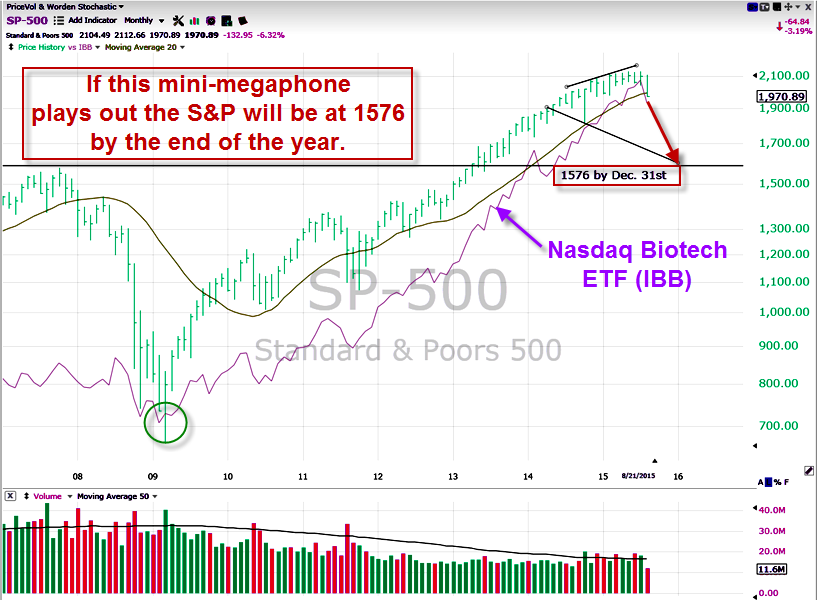
The monthly chart shows an extended parabolic rally in the S&P 500 starting in 2009 that mirrors the move in the over-loved Biotech sector. When indices correct these extreme moves, unlike individual, well-behaved stocks, they tend to print expansion patterns, i.e., megaphones.
Drawing a mini-megaphone that incorporates the October 2014 low, projects in time and price to the 1576 level by the end of the year. That’s the 2008 high and if we begin to approach it, it will become a ‘strange attractor.’
All in all, such a move would amount to a 26% correction in the S&P 500; just barely a bear market.