OK, the title is a bit of an attention grabber but it is worth your time as an investor and trader to read this article.
Volume-at-price analysis is incredibly robust and consistent. Compared to other technical methods or tools, there is no comparison.
As the S&P 500 made its first new highs of 2015, the critical support zone at 2034 – 55 had already been established and defined as key support. Below are excerpts from my analyses provided to most of the ‘too big to fail’ investment banks and nearly 20,000 other financial professionals over that span of time. They were a constant warning of the likely outcome if that critical support zone was breached.
March 6, 2015 (initially published the critical support zone at 2034 – 55)
If the index were to breach 2034 – 55, this would be a substantially bearish development and is not something that we are anticipating. Currently, the bullish big picture remains intact
March 25, 2015 (first outlined scenario of a breach of the critical support zone 2034 – 55)
The S&P 500 has been in an uptrend within an ascending trend channel for the last few years. While the trend channel is maintained, along with key support at 2034 – 55, the long-term trend will point upwards.
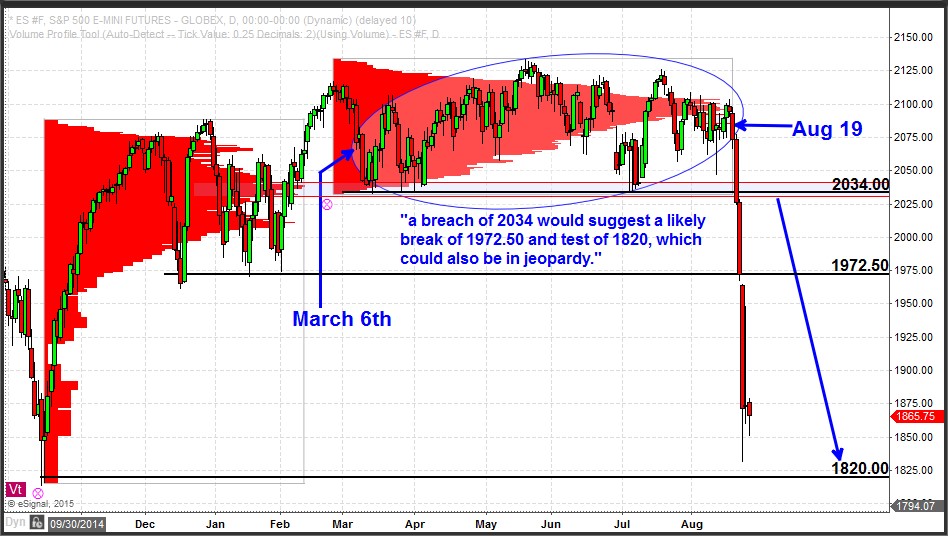
A failure to maintain the trend channel (and support at 2034 – 55) would be a signal that the character of the bull market we’ve been in for the last few years is changing. That means a breach would suggest that the steady bull market could be shifting to a bear market (or a volatile rotational market). For this reason, any breach of key support at 2034 – 55 would be a significant event. A breach of 2034 would suggest a likely break of 1972.50 and test of 1820, which could also be in jeopardy.
Included in my published analysis a total of 43 times because the S&P was consistently within striking distance of this critical zone…
A failure to maintain the trend channel (and support at 2034 – 55) would be a signal that the character of the bull market we’ve been in for the last few years is changing. That means a breach would suggest that the steady bull market could be shifting to a bear market (or a volatile rotational market). For this reason, any breach of key support at 2034 – 55 would be a significant event. A breach of 2034 would suggest a likely break of 1972.50 and test of 1820, which could also be in jeopardy.
August 19, 2015 (first and only warning that downside breach was most likely underway)
Stock Indices Leaning Down
The S&P 500 has been traversing the same territory for months. It has formed a substantial high-volume area with a peak near 2103. This prolonged consolidation is very mature and a move to exceed one of the extremes increases in likelihood every day. While below the peak of this mature high-volume area (2103), the index is leaning toward a downside resolution.
A failure to maintain the trend channel (and support at 2034 – 55) would be a signal that the character of the bull market we’ve been in for the last few years is changing. That means a breach would suggest that the steady bull market could be shifting to a bear market (or a volatile rotational market). For this reason, any breach of key support at 2034 – 55 would be a significant event. A breach of 2034 would suggest a likely break of 1972.50 and test of 1820, which could also be in jeopardy.
But that’s all in the past now. Looking ahead, here’s what my volume-at-price analysis suggests…
This move to the downside leaves a formidable zone of resistance at the high-volume area that has been built since March. This new robust resistance zone is 2092 – 2115.
There is no reason to be bullish in the big picture at the present time unless the resistance zone at 2092 – 2115 were to be exceeded to the upside. Additionally, the Nasdaq 100 and Russell 2000 are in similarly bearish positions, putting each of these 3 indices in synch to the downside.
Following a lengthy consolidation such as we saw over the first half of this year, the eventual resolution (in this case down) marks a significant event and establishes the future direction of the stock market and a persistent and directional move lower is my expectation.
If you’d like to learn more about how to use volume-at-price information in your trading, visit