

“Ask Kase” and your question may be chosen as the subject of a future column (askkase@kaseco.com).
Clearly markets have been declining as the drop in demand in China has finally hit hard. It’s easy to sustain robust growth from a low base, but as an economy grows, that becomes more difficult, as China’s machinations show. The spillover to the Dow Jones Index has been evident since mid-May as its been oscillating in a downward pattern since then, bouncing down the cliff, as anyone paying attention will have seen. It’s now rolled off the cliff edge. Now what?
Before delving into the numbers, let’s take three lessons from the recent sharp decline. Always use stops. Monitor intraday charts when risk is high, and especially when there is a choppy sideways consolidation. Keep an eye on momentum divergence.
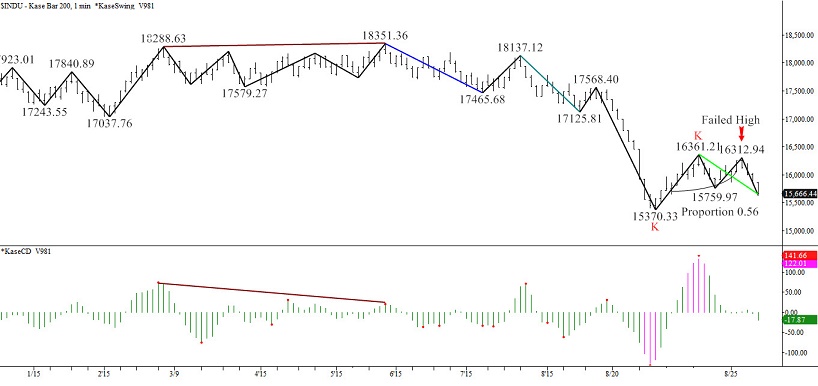
Kase’s “drop dead” stop was around 16,750. Monitoring a 200-point range Kase Bar generated a chart which was more detailed than the daily chart, but not noisy. This chart formed a classic momentum divergence at 18351.36, allowing an exit at about 18,000 or so.
Kase 200-Point Bar Chart with Divergence
Charts created using TradeStation. ©TradeStation Technologies, Inc. 2001-2015. All rights reserved. No investment or trading advice, recommendation or opinions are being given or intended.
The index stalled about 100 points above a major target to which three recent waves down project – about 15,270. The wave in blue extends to this level as the Phi-cubed corrective projection. The “trend terminus” for the wave in cyan and the 0.62 extension for the most recent wave in green is 15,270.
The correction up from 15,370.33 is not encouraging. Its second leg only extended by 56 percent, instead of the minimum 62 percent normally expected, and its 16312.94 high failed to overcome the earlier swing. The 15651.24 ending low broke below the intermediate 15,759.97 swing, wiping out its upward targets. Tuesday closed below Monday even though its low held higher.
The fact that INDU bounced at a level 100 points higher than the key target may be its salvation. So watch 15,270. This is a major retracement as the table below illustrates, and the next daily Kase DevStop.
The next two key targets and significant retracements are 15,000 and 13,670. There’s interim support at 14,700 and 14,200. Below 15,000, though, odds favor an acceleration to 13,670. This is a six sigma move on the weekly chart. Below that. I’d look for 11,000.
Retracements to 18,351.36
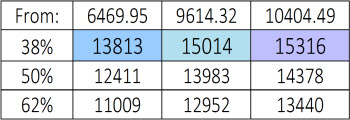
Watch 16,750, 17,250, and 18,025 on the upside. These are the two, three, and six sigma moves up on the weekly chart. 16,750 is last Friday’s open-close midpoint. 17,250 is the 62 percent retracement of the move down. It is also the smallest, 0.62 extension of the large structural wave 15340.69 – 18351.36 – 15370.33. A sustained close over means 18,000 will probably be overcome. 18,025 is the 89 percent retracement and just above June’s open.
INDU could hold support and meander for a while, but must close over 16,750 fairly soon to look for stability and at least the chance of a recovery. Otherwise, don’t step IN-[the]-DU-DU.
Send questions for next week to askkase@kaseco.com, and click the link learn more about Kase’s trading indicators and DevStops.

