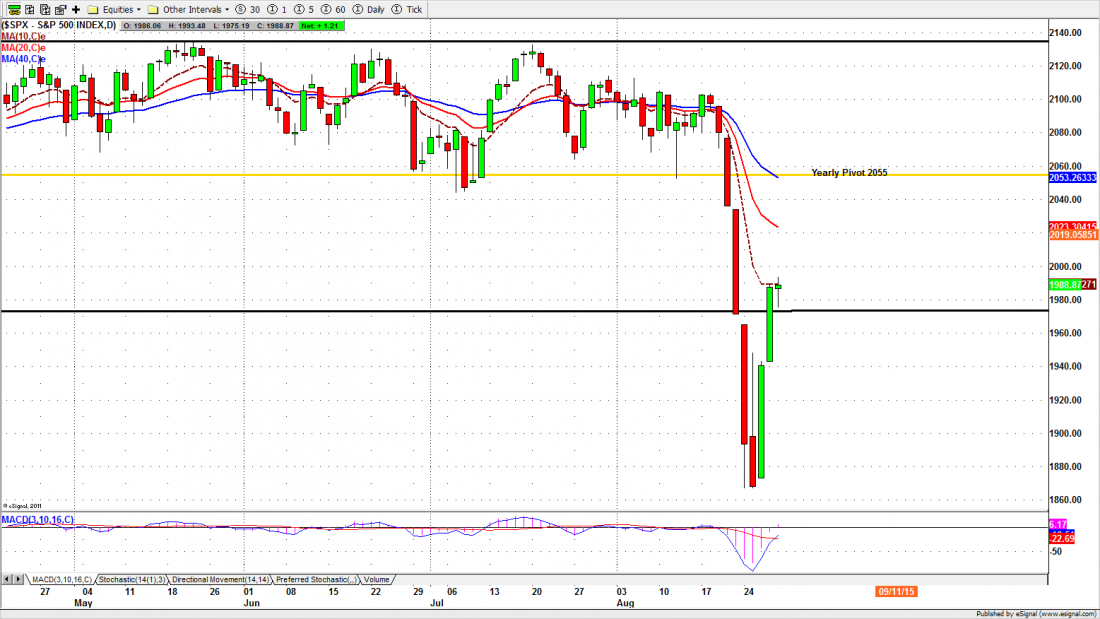
These are interesting times in the markets. In the course of two weeks the S&P500, the large cap index for US equities, has had both the biggest one-day drop and the biggest one-day rally since 2011. In a market where, until now, the range for the week was typically about 75 points, we have seen declines and rallies that moved that far in a couple of hours.
On Friday the SPX closed at 1988.87, up 17.98 points for a net weekly gain of 0.09%. But what it did to make that miniscule gain left many traders breathless – and some broke. (But not the members in our trade room; they made money on both moves this week).
After dropping 130 points the week before, the SPX opened down last Monday morning and dropped another 100 points to make a low at 1867 (the futures hit 1831) or 230 points below where it had traded the week before.
And then, miraculously, it stopped, turned around, and rallied 120 points in two days to close green for the week, if only by a fraction.
Somebody expended a lot of effort and money to generate that rally. Whether it will last or not is another question. Overnight the futures traded down 30 points, then slowly clawed back to a crucial support area around 1972.
That doesn’t tell us much about what lies ahead. At this stage we could be heading for another Black Monday; or we could march proudly back to the previous highs. But one thing is certain: this story isn’t over yet. This week could be equally “interesting.”
This week
We see this sharp decline as the intermediate-term correction we’ve all been watching for, not a crash. We don’t think it’s over yet, but we think the volatility will slow down a little.
Today and early this week we will watch the 1972 level carefully. That was last December’s low and it controls the downside move. As long as it holds the index up it will force shorts to come in to cover. But as soon as – or if – the price goes under 1950 it will re-trigger selling pressure and push the index further down to fill the unfilled gap in the 1940.50 area. Monday’s closing price will give us a hint at the future direction.
The futures
The S&P500 mini-futures (ES) had the same miraculous recovery as the SPX. Friday they closed above the 10-day moving average line, but the volume was less than any of the previous four days. Last night they dropped quickly on rumors of more trouble in China, then recovered somewhat. What they do next will point to the future direction of the market.
The first resistance level is the 62% Fibonacci retracement level around 2001.75. The first support is the 1971-61 zone, the broken support of the 10-month sideways consolidation.
The ES is chopping around this area and the Bulls need to defend it vigorously. If they fail, the next likely support is an unfilled gap around 1938-36.50.
The major support levels for Monday: 1938-35, 1922-18.50, 1905-00, 1875-50.50;
major resistance levels: 2015-18.50, 2029-28.50, 2035-38
For more detailed market analysis from Naturus.com, free of charge, follow this link


