There are few phenomena in the market that catch investors’ speculative fancy more than the proverbial “Hot IPO.” In recent years we have seen a number of these Initial Public Offerings of companies with a “hot,” compelling, and highly trendy business theme. In recent years we’ve seen a number of these “IPO manias.” Facebook (FB), LinkedIn (LNKD), and Twitter were all highly sought after IPOs as a result of increasing investor excitement over the “social-networking space” over the past 4-5 years. Consumer Technology IPOs like Fitbit (FIT), Mobileye (MBLY), SolarEdge (SEDG), and GoPro (GPRO) have been more recent hot new issues, among many others. Generally, what drives the mania-like interest in these names is strong name recognition or a strong franchise and compelling product theme within an industry space that is experiencing rapid growth or which is perceived as having the potential for rapid growth.
Our fist example, Facebook (FB) came public on May 21, 2012, opening up that day at 36.53, below its $38 IPO offering price. It then set off on a steady downtrend from there, finally bottoming out a little over three months later, on September 4th, at 17.55. Anyone who bought into the hype of that IPO, whether they were “lucky” enough to get an allotment of shares from the broker at the offering price, or in the immediate after-market on the first few days of trading, was literally left holding the bag. One critical factor that most investors who bought into the IPO probably forgot to consider was the sheer size of the offering and its potential to saturate demand for the stock rather than whet it. After all, at $104 billion, Facebook had garnered the largest valuation in history for a newly public company, and the number of shares that were issued, 421 million, represented a deluge of stock entering the market. Certainly, demand for the stock was strong, but the amount of total share supply that was eventually offered soaked up all of that demand and more.
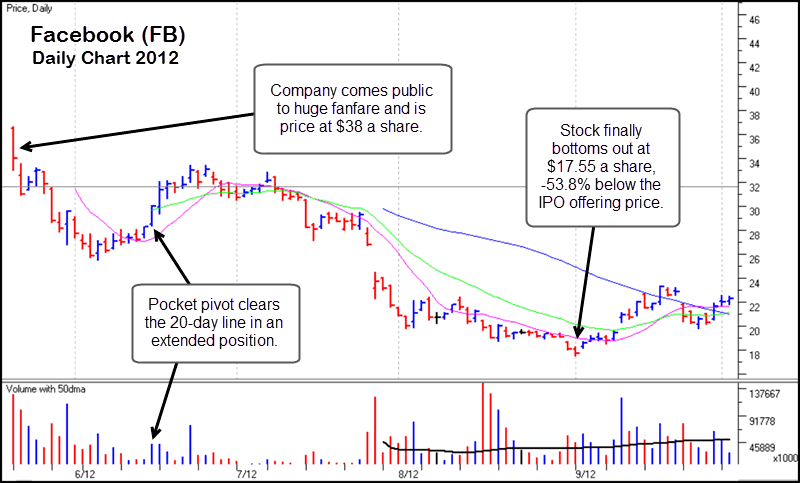
Chart 1 – Facebook (FB) daily chart, 2012. Chart courtesy of HGS Investor Software, LLC, ©2015, used by permission.
Facebook illustrates why I never buy a hot, new IPO on the first day of trading, despite all the speculative fever surrounding such an event. Twitter (TWTR), shown below in Chart 2, provides further support for such an “early avoid” policy when it comes to handling these types of IPOs. TWTR was arguably a very hot IPO at the time it came public on November 7, 2013 at $26 a share. On that day it opened for trading at 45.10, ran up to 50.09, and then slumped to end the day at 44.90. From there it slowly slid down to a closing low of 39.06 twelve trading days later. However, note how the stock was essentially moving very tight sideways in a consolidation. Once it moved back above the 10-day moving average three days after posting that final low, volume dried up very sharply, indicating that IPO profit-takers in the stock were disappearing. Immediately thereafter volume picked up and the stock broke out through the declining tops trendline that I’ve drawn across the highs of TWTR’s post-IPO consolidation. This move provides a proper low-risk entry point on the long side, and it led to a very rapid upside move of approximately 68% over the next 15 trading days.
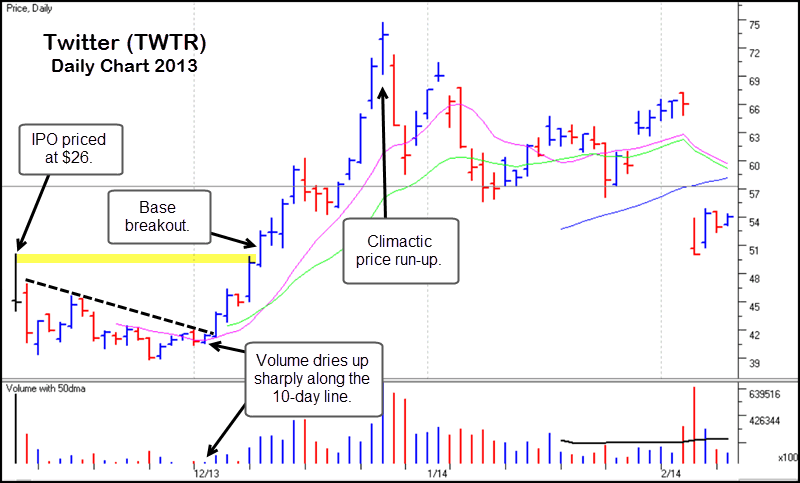
Chart 2 – Twitter (TWTR), daily chart, 2013. Chart courtesy of HGS Investor Software, LLC, ©2015, used by permission.
By exercising patience, and not getting swept up by the emotion of greed surrounding TWTR’s “hot IPO” status on the day it first began trading, it was a simple matter to let the stock settle down and form a proper consolidation. Once that had occurred, the ensuing buy signal from there was easy to recognize, and let to a very profitable upside move.
GoPro (GPRO) is another example of a hot IPO that was able to move higher after it first came public and began trading on June 26, 2014. Again, it was not necessary to incur the risk of buying a volatile IPO right after it entered the after-market. Instead, one could have allowed the stock to set up in its first consolidation, which GPRO did after a quick three-day spurt to the upside following its IPO day. In the latter part of August the stock flashed what my colleague Dr. Chris Kacher and I refer to as a “pocket pivot” buy point, an early buy signal that can occur within a base. This provides an “early-mover” advantage over buying standard new-high base breakouts and is discussed in detail in our first book, “Trade like an O’Neil Disciple: How We Made 18,000% in the Stock Market” as well as in the FAQ section of www.virtueofselfishinvesting.com. We can see in Chart 3, below, that the pocket pivot buy point preceded the base breakout by eight trading days. The base breakout also came as the stock was emerging from an allegedly “faulty” double-bottom base where the second low of the base does not undercut the first low, but it worked anyway. GPRO then essentially doubled from there, and that move up to the 95 price area at the right of the chart was far more significant than trying to game the stock right after it began trading in late June 2014.
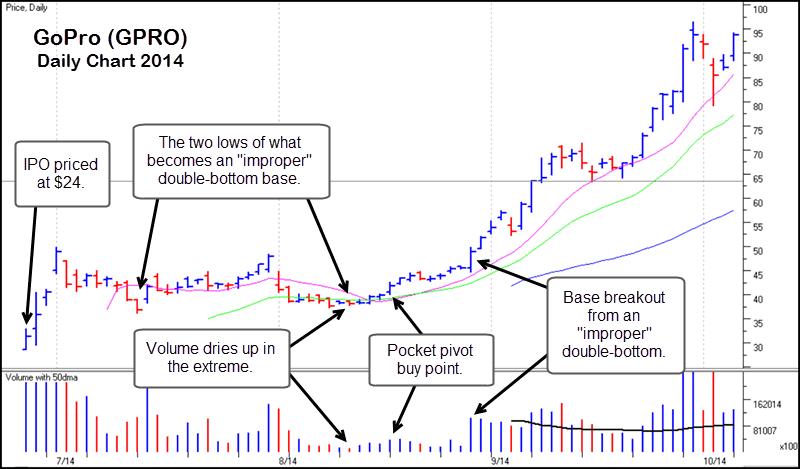
Chart 3 – GoPro (GPRO) daily chart, 2014. Chart courtesy of HGS Investor Software, LLC, ©2015, used by permission.
GPRO illustrates the idea that while a hot IPO may indeed be hot, and even have a short upside spurt right after the day it enters the after-market, the real upside move occurs some time later. This gives investors a chance to catch their breath, and let the stock set up for a more significant move. Remember, if an IPO is truly that “hot,” then it will demonstrate that over time, not just on the day of or the days immediately following the IPO date.
SolarEdge (SEDG) was a hot IPO back on May 26, 2015 as a maker of solar power inverters, a hot new concept within the solar industry that addressed the issue of storing solar-generated electricity in an efficient manner. Right after entering the after-market, SEDG began a slow but steady upside trek that might have perplexed any investor searching for an entry point within the pattern, as can be seen in Chart 4. However, even within this slightly up trending pattern there emerge two pocket pivot buy points and one buyable gap-up that offered clear reference points and signals for a long entry. In fact, I actually recommended the stock in The Gilmo Report as a buy three days after that first pocket pivot around the $24 price level. But even if we measure from the close of the buyable gap-up day at 31.10 to the final peak at 43 in late June 2015, we find that the stock posted a 38% gain. Again, patience, and the fortitude to wait for a proper buy point to emerge well after the initial IPO day paid off for the wise investor.
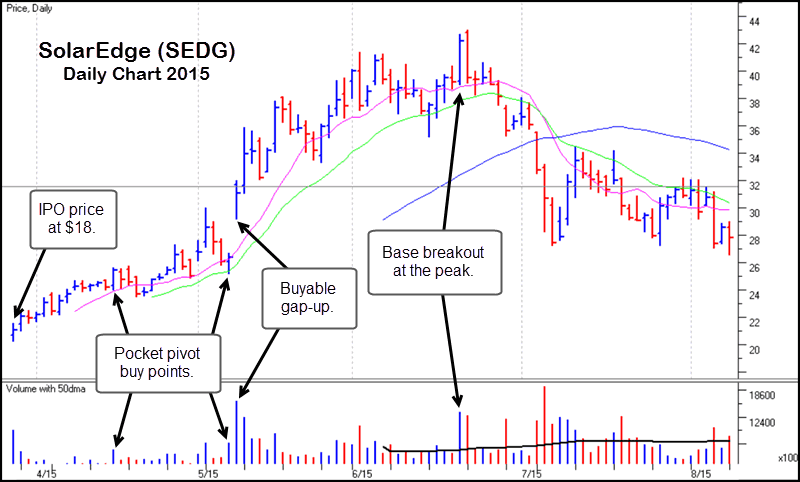
Chart 4 – SolarEdge (SEDG) daily chart, 2015. Chart courtesy of HGS Investor Software, LLC, ©2015, used by permission.
The buyable gap-up concept is in fact a very simple one, and it can be very powerful when seen on a hot IPO’s initial breakout from an early base formation. The first requirement is that the stock be gapping up and out of a constructive sideways consolidation on volume that is at least 150% above-average. The gap move should be of sufficient magnitude, specifically at least 0.75 times the 40-day average true range of the stock on the day before the gap-up move occurs. Generally this can be “eye-balled” on the chart as a strong, up-thrusting move that is not tentative or slight. We can see in the example of FireEye (FEYE), shown in Chart 5, below, that it gapped up very strongly out of a slight longer than three-month consolidation if formed after coming public on September 20, 2013. The stock was a hot IPO at the time by virtue of its place within a burgeoning field of computer security, a topic of great interest as a result of numerous large-scale computer hacking attacks appearing in the news. However, it was not necessary to buy the stock at the time of the IPO, or even the days immediately following the day it started trading in the after-market. One only needed to buy into the buyable gap-up move that occurred a little over three months later in order to capitalize on a nearly two-fold move from there.
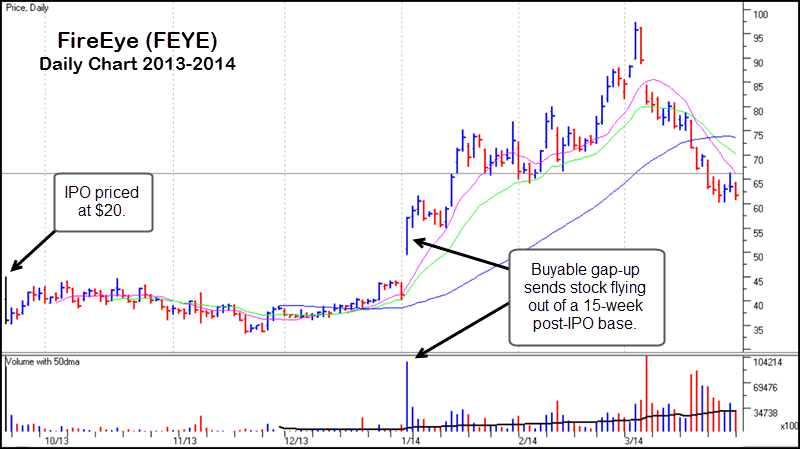
Chart 5 – FireEye (FEYE) daily chart, 2015. Chart courtesy of HGS Investor Software, LLC, ©2015, used by permission.
The message I’m trying to get across here should be quite clear. Greed, hype, and IPO “fevers” have no place in the decision-making of prudent investors. Even when a stock is considered to have great potential and therefore able to garner interest as a hot IPO, it is not necessary to be swayed by the impulse of greed and jump in right away. Instead, investors should develop an understanding of how hot IPOs will set up as the initial IPO excitement dies down and present watchful investors with the most optimal, and lower-risk, long entry points. As it is written, “To every thing there is a season, and a time to every purpose under the heaven.” And so it is with hot IPOs.
Gil Morales is a proprietary trader and the CEO of Gil Morales & Company, LLC, a registered investment advisory firm, as well as the author of the Gilmo Report (www.gilmoreport.com). He is also a principal and managing director of MoKa Investors LLC and Virtue of Selfish Investing, LLC, as well as a co-author and co-founder with his colleague, Dr. Chris Kacher, of www.selfishinvesting.com. He and Dr. Kacher are the co-authors of the best-selling books, “Trade like an O’Neil Disciple: How We Made 18,000% in the Stock Market” (John Wiley & Sons, August, 2010), “In the Trading Cockpit with the O’Neil Disciples,” (John Wiley and Sons, December 2012), and their newest book, “Short-Selling with the O’Neil Disciples: Turn to the Dark Side of Trading” (John Wiley & Sons, April 2015). He is a former internal portfolio manager for William O’Neil + Co., Inc., where he also served as Chief Market Strategist, Vice-President and Manager of the firm’s Institutional Services group from 1997-2005, and co-authored with William J. O’Neil a book on short-selling, “How to Make Money Selling Stocks Short” (John Wiley & Sons, 2004).


