
Trading a Recent Day by Price & Volume
The best traders learn to read the markets by price and volume alone, without indicators. Indicators can certainly be helpful to the trader when used properly, but they can also cause confusion. The same indicator signal that produced a winning trade yesterday can generate a loss today. Being able to read the chart—even if you continue to use indicators—is a skill that will serve the trader well.
Selling Off the Open—Two Short Trades
A 5-minute chart of the S&P e-mini (ES) on a recent trading day is shown below. Immediately after the US session opens, the market falls through modest support with increased volume (bars A, B & C). Supply has entered the market. The trader should now be looking for short trade opportunities, and a choice trade presents itself at D. Note the low volume on the rally into resistance. Buyers could not take control of the market, and the reversal bar at D is an excellent place to short.
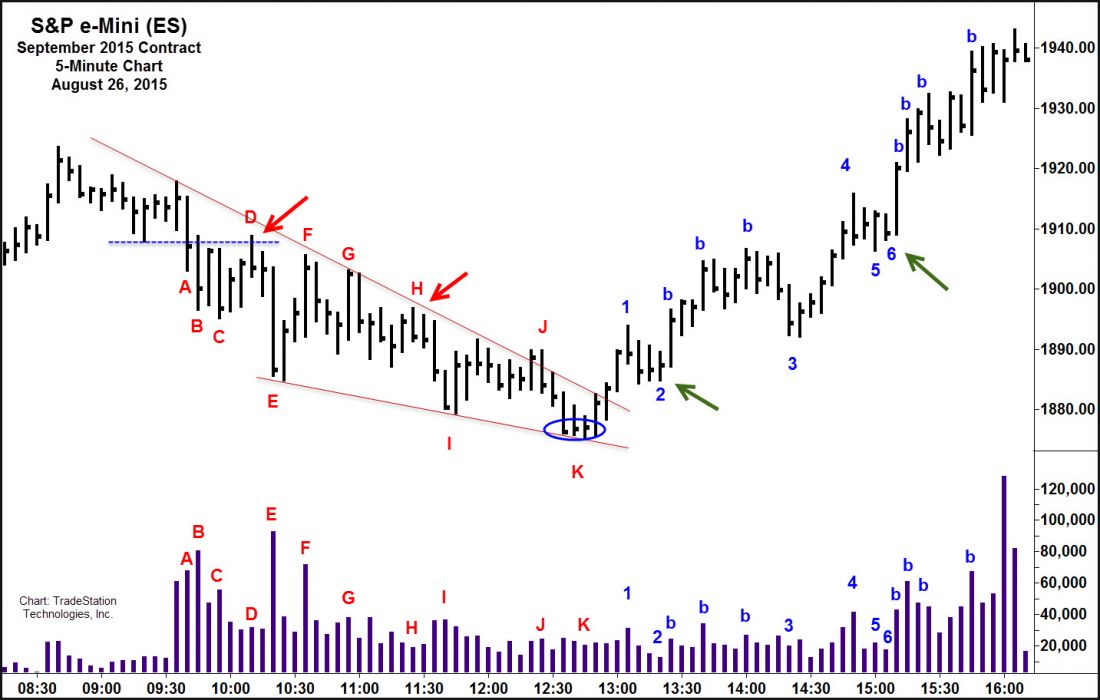
In the next 10 minutes, the market swiftly falls 17 points ($850/contract) and the savvy trader would cover at least part, if not all, of her shorts around the lows of E as heavy volume emerges. Sudden volume spikes like those occurring at E and again at F, often signal the market will reverse.
At G, the market again tries to rally, but fails. Compare the volume at G with the volume at F. The market tries to push through the same price area, but on significantly less volume. There isn’t enough fuel behind the up move, and the next bar reverses. After going sideways for 25 minutes with weak upside volume, the market is ripe for another short at H.
Getting Ready to Rally
Again, the market falls swiftly (about 12 points; $600/contract) over the next 15 minutes. Note that the range of price bar I is significantly smaller than the range of the last bar (E) to drive down. The volume is also significantly lighter. These are telltale signs that the selling is beginning to dry up.
By the time the S&Ps get to K, we see the drives down have shortened, volume is the lowest of any push down, and closes are clustered at the same level—clear signs the morning down draft is over.
Rally and First Long Trade
Confirmation comes on the rally to 1. Price breaks the down trend line and volume increases on the rally. The pullback to 2 shows diminished down volume and the same clustering of closes as seen at K. This is the first opportunity of the day to go long.
Longs are rewarded as we see buying push the market higher. Note that each bar driving up (“b”) brings out increased volume, a strong sign the market is now in a rally mode. A pullback to 3 does not bring out supply, though an entry here is not especially clear. The smart trader waits for a better opportunity.
This comes after the strong rally to 4. Note solid upside progress in the price bars with each closing on its highs. Volume also expands on the rally, another indication buyers are in control.
A Second Long Trade
After the rally to 4, the market runs sideways for 15 minutes, unable to react lower. Bar 5 shows buyers eager to push prices up, and bar 6, a narrow bar with light volume, shows no supply at this level and an excellent spot for a long entry.
Once again, buyers push price up aggressively, seen on the ascending “b” price bars with good volume, wide ranges and strong closes. A trade held into the close netted about 15 points ($750 per contract).
Learning to read a market’s price and volume is of great benefit to trading all markets—equities, futures and even FX. You can see how we do this in a free video focused on chart reading and trade execution by price and volume at the author’s website.

