Monday
ESZ5 – regular trading hours, Sept. 14
![]()
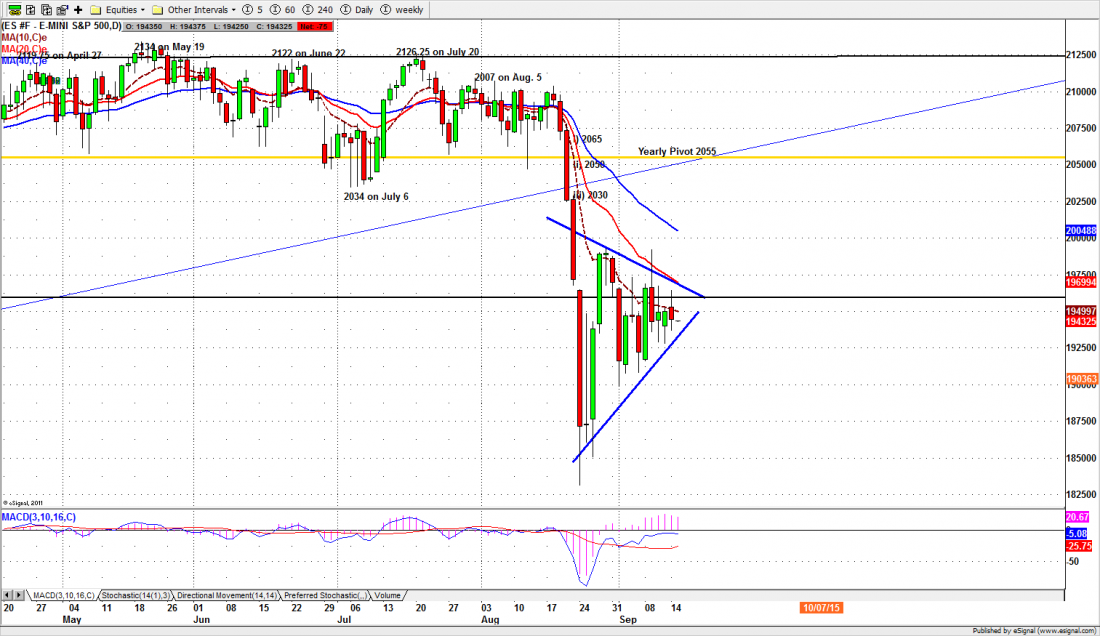
Ever since the market crashed on August 24, the S&P500 has been trapped inside a triangle pattern (see chart) as the price makes a series of higher lows and lower highs.
When the price nears the descending top resistance area, the sellers step in and push the price down; when the price nears the ascending lower support level, the buyers emerge and push it back up.
This produces a kind of balancing act where the Bulls won’t let the price go too low, and the Bears won’t let it go too high.
But at some point that balance has to break. One side will succeed in pushing the price to a new level, and the market will move outside the triangle to new territory.
That will almost certainly happen this week. But it didn’t happen Monday.
The event that will shatter this precarious equilibrium is the Fed Open Market Committee Meeting on Wednesday and Thursday. As usual the Fed is discussing an interest rate increase, which – if it happens – will be the first in nine years.
No matter what decision is made the market will move outside of that neat little triangle. We just don’t know which way it will go.
Today
Lots of rumors, lots of speculation, lots of attempts to whip the market around ahead of the Fed decision. But most of the big money will be waiting for the Fed. Nobody wants to be caught leaning the wrong way when the market explodes. We expect more sideways consolidation perhaps with the price swinging in reaction to the rumor mill.
The Retail Sales report and the Empire State Manufacturing survey will be released this morning before regular hours trading begins. The Street expects the Retail Sales data may influence the Fed’s decision. We don’t think so.
From a technical perspective, 1950 will be the line in the sand for the Index. There is heavy Put activity at this strike price. A close below 1950 could lead the price toward the next heavily-bought strike at 1900. Holding above 1950 could lead to short-covering and push the price up. Anything can happen this week.
Major support levels for Tuesday: 1900-03.50, 1975-80, 1850-45, 1828.50-25;
major resistance levels: 1992.75-95.50, 2012.50-2013.50 2032-2035
For more detailed market analysis from Naturus.com, free of charge, follow this link
Chart: S&P500 mini futures (ESZ5) daily chart Sept. 14, 2015