

In my last update the worst isn’t over, I mentioned an ABC pattern that had a 2031-2071 target for the final wave “C” up. The SPX was only able to get to 2021 before reversing, but that made sense, as the “Time” aspect of the reversal equation, well-ran out of time. I have said more than once, knowing “WHEN” to expect a reversal is equally as important as “WHERE” the SPX may reverse.
Since September 3rd, Woody Dorsey (sentimenttiming.com) has been saying his technical timing profiles are expecting the bounce off the August lows to make a top on 09/17. Anybody who started shorting the SPX based on price or resistance after the August lows, were swimming against the tide and many got stopped out right before the big drop started-right on his 09/17 turn date.
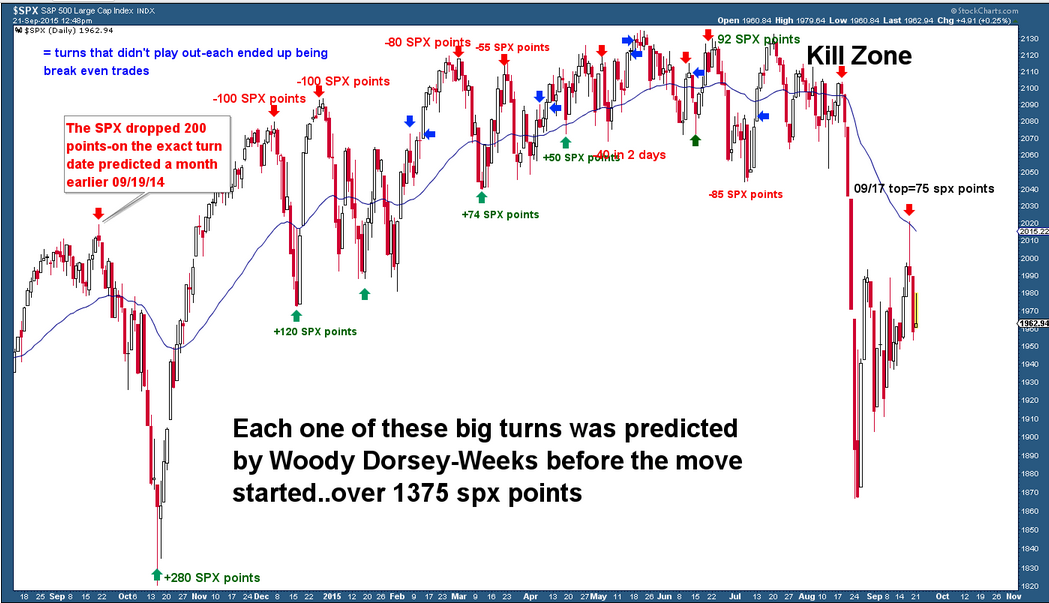
Knowing “when” to expect a reversal gives you an unfair advantage over 99% of all market participants. Everything traders use is based off of price, not time. Being able to combine “price and time” gives you the full picture as to when and where to start looking for a reversal. On August 3rd, Woody predicted that the SPX was going into what he called “The Kill Zone” which was set to hit the week of August 14th-21st and the SPX started crashing on August 18th.
The 09/17 turn date lower was also supported by a series of extreme bullish sentiment readings. We had 4 bullish sentiment extremes hit as the SPX was trading at the lower end of the price range from the August crash. We now know that many traders are trapped after Thursday’s reversal lower.
We already know when to expect the next low based on Woody’s turn date and combining that with price/patterns, seeing the SPX test the 1924 area wouldn’t surprise me. But if it gets there before the expected low dates, then odds of it heading below 1900 again increase greatly. Knowing when to expect the low-makes charting where to expect the low, a lot easier. We aren’t there yet-so expect lower lows.

