Ten days ago I wrote an article for TraderPlanet in which I described the big picture technical vulnerability in the Nasdaq 100 tracking stock (QQQ). A similar vulnerability in the short-term can be observed through an analysis of volume at price (aka, Volume Profile).
The Volume Profile principle is simple: if you are a Bull you want significant volume accumulation in zones below the current price action because those areas will act as support during a correction. And vice versa if you are a Bear.
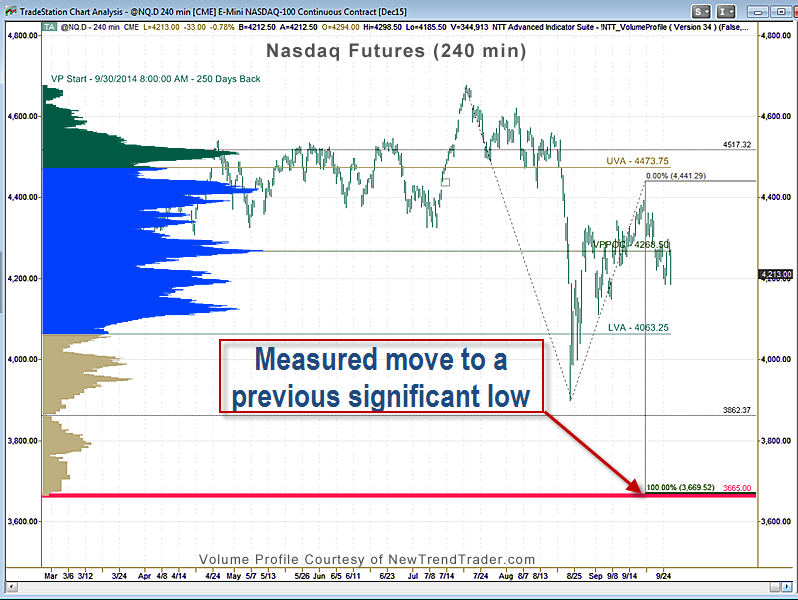
Unfortunately, in the Nasdaq 100 futures, the highest volume over the last 12 months occurred at 4268, a level that is now going to act as resistance, not support.
Two other factors suggest that the Nasdaq 100 is headed seriously south. First, we have the panic low from October 2014 at 3665. That price is a psychological reference point in every fund manager’s mind, and the closer we get to it the more magnetic it will become.
Moreover, markets move symmetrically more often than you might think. Measuring from the 7/20 high to the 8/24 low gives us a yardstick by which to project the ‘C’ leg of a simple ABC correction. That leg ends at ~3660, close enough to reinforce the importance of this level in traders’ and investors’ hearts and minds.
I could probably come up with a 3rd type of confluence, but I don’t think it is necessary. You get the picture. What this means in simple terms is this is a good time to practice your short selling skills. Don’t get faked out by the sudden breathtaking rallies that punctuate such declines. Rallies are for selling.
To find out more about how to stay safe in a down market visit daytradingpsychology.com