

One of the most valuable aspects of using volume-at-price information is that you are able to consistently and unambiguously define a good trading opportunity according to what the market has defined as important.
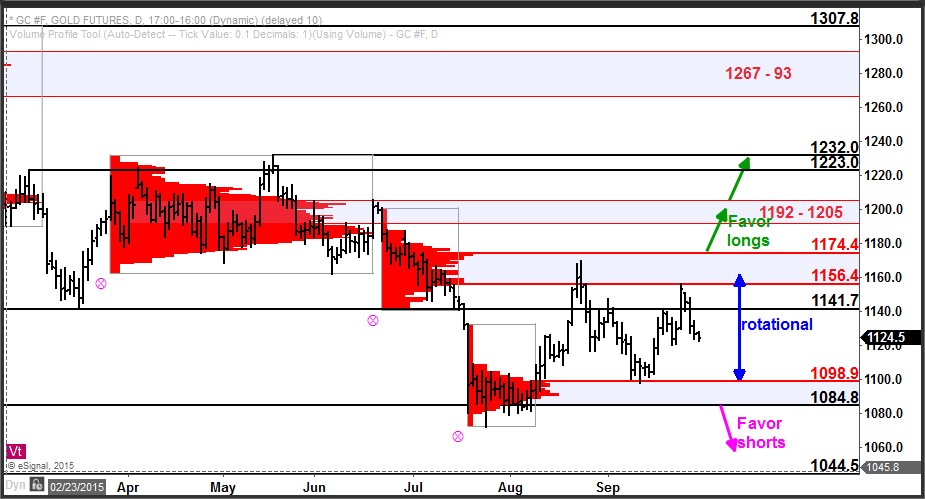
Gold dropped from above 1200 to below 1100 earlier this summer. Since making a late July low at 1072, gold futures have oscillated back and forth between 1100 and 1160.
The August high and September low were both tests of high-volume area resistance and support zones. The August high was a test into resistance at 1156.4 – 1174.4. This was a high-volume resistance zone to expect selling pressure to enter the market. And it did.
The decline from that test of resistance went lower until it reached the high-volume area support at 1084.4 – 1098.9. This was an area to anticipate buying pressure to enter the market. And it did.
At present, gold remains in a rotational state below the resistance zone at 1156.4 -1174.4 and above the support zone at 1084.4 – 1098.9.
A move above 1174.4 would shift the bias to bullish and target a test of 1192 – 1205 and potentially 1223 – 32. Conversely, a breach of 1084.8 would instead shift the bias to bearish and target a move to test 1044.5.
If you’d like to learn more about how to read markets using volume-at-price information, click here. http://www.volumeatprice.com

